August 2017
Capillary sequencer
Madelyn Voelker, graduate student
August 2017
This past month I have been learning to use a new and exciting machine - the capillary sequencer! This is what it looks like, may not seem too exciting, but trust me, it is.
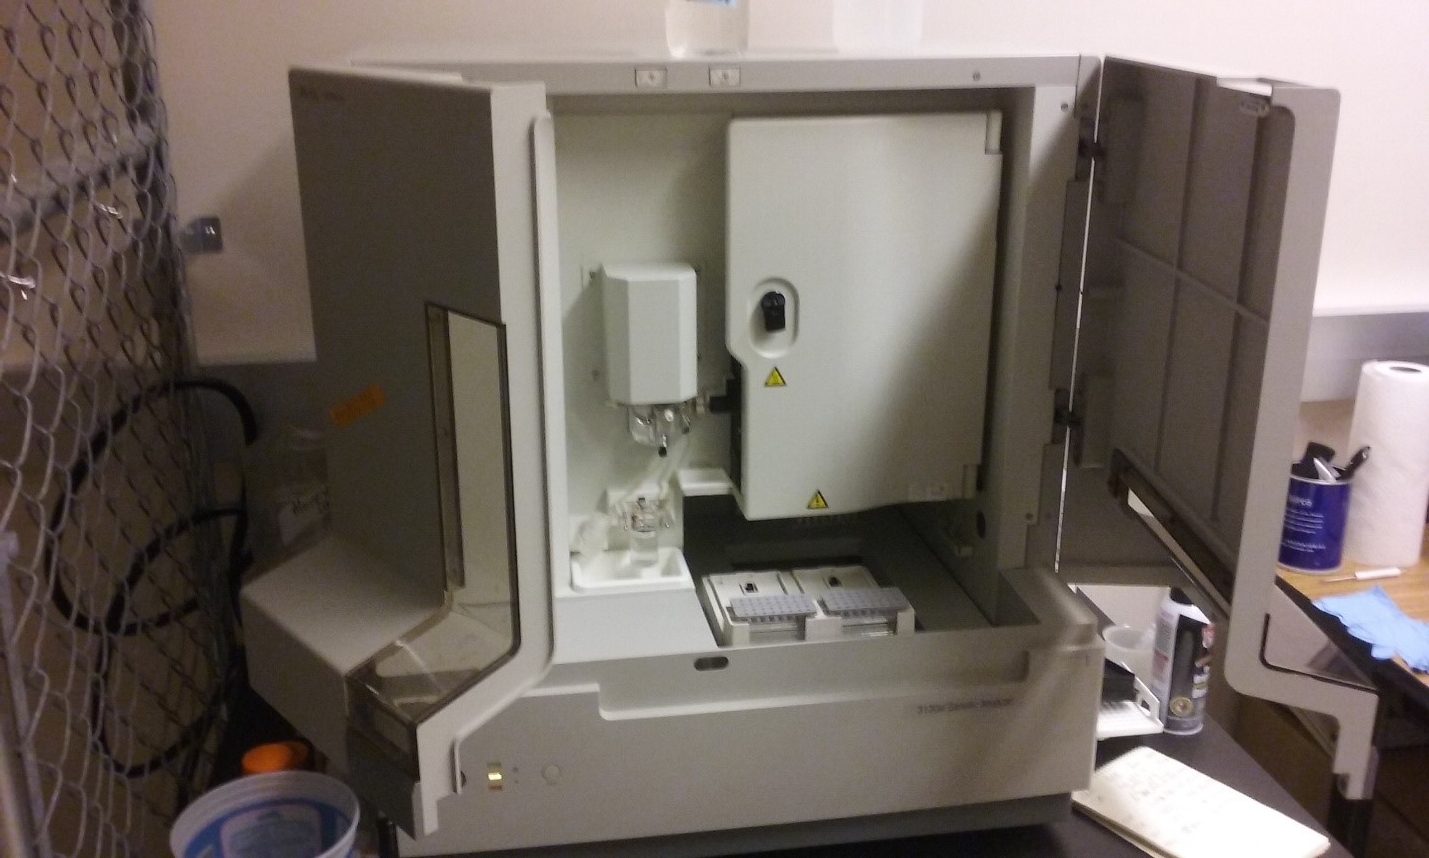
ABI prism 3130x1 Genetic Analyzer. Photo by M. Voelker.
This bad boy allows me to determine the length of the DNA fragment that I amplified using PCR. It does this by measuring the florescence of DNA fragments as they pass through a gel (it is a fancy form of gel electrophoresis). This is possible because each PCR was completed using fluorescent primers. The PCR products were then run on the capillary sequencer along with DNA fragments of known lengths (size standards). By measuring where each DNA fragment of my PCR products moved to in the gel in relation to the size standards, the length of the DNA amplified from my samples can be calculated. The results are given in the form shown below. The larger the peak, the more DNA fragments that were fluorescing in that size range. Because I know the range of lengths to expect for each microsatellite it is fairly easy to tell if the DNA amplified was the microsatellite. For the microsatellite I am currently working on, I expect fragments in the 119-139 base pair range. Peaks that show up outside of that range are likely just extraneous DNA fragments. However, it is not all that straight forward to get anything to show up.
The laser in the capillary sequencer that is responsible for detecting the fluorescing DNA fragments is very sensitive, and thus only works within a small range of DNA concentrations. Too little DNA in the sample, and the laser won’t be able to pick up any florescence. Too much DNA, and the laser is overwhelmed by the amount of light being given off by the sample, and cannot accurately estimate the lengths of the fragments. The first of those scenarios looks like this:
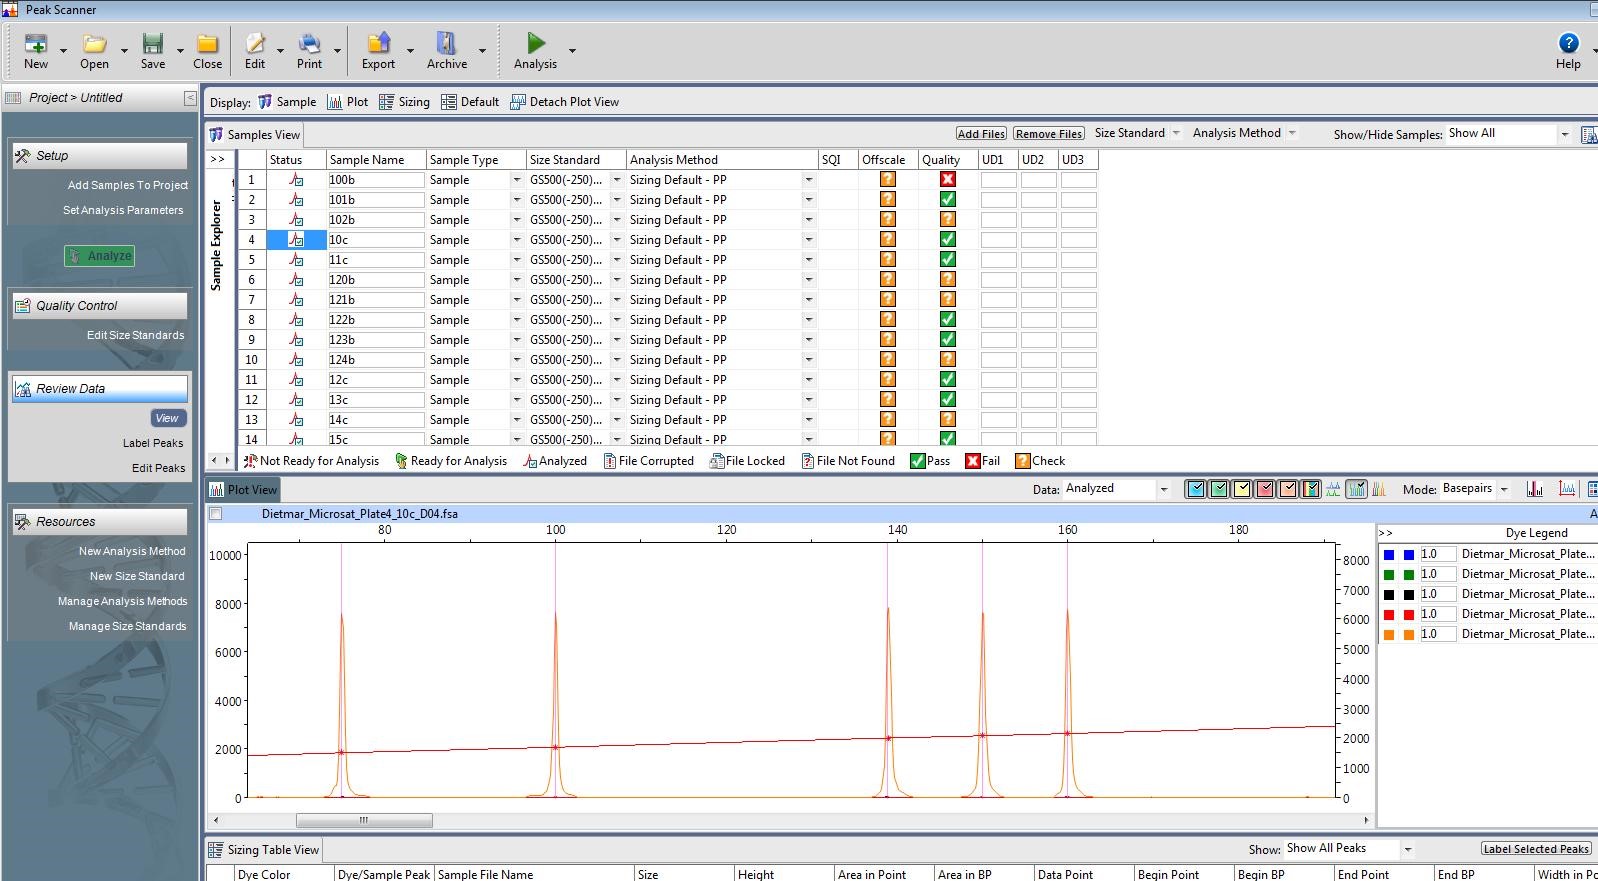
Not enough DNA for the laser to pick up. The orange peaks are the size standards. Photo by M. Voelker.
The second of those scenarios looks like this:
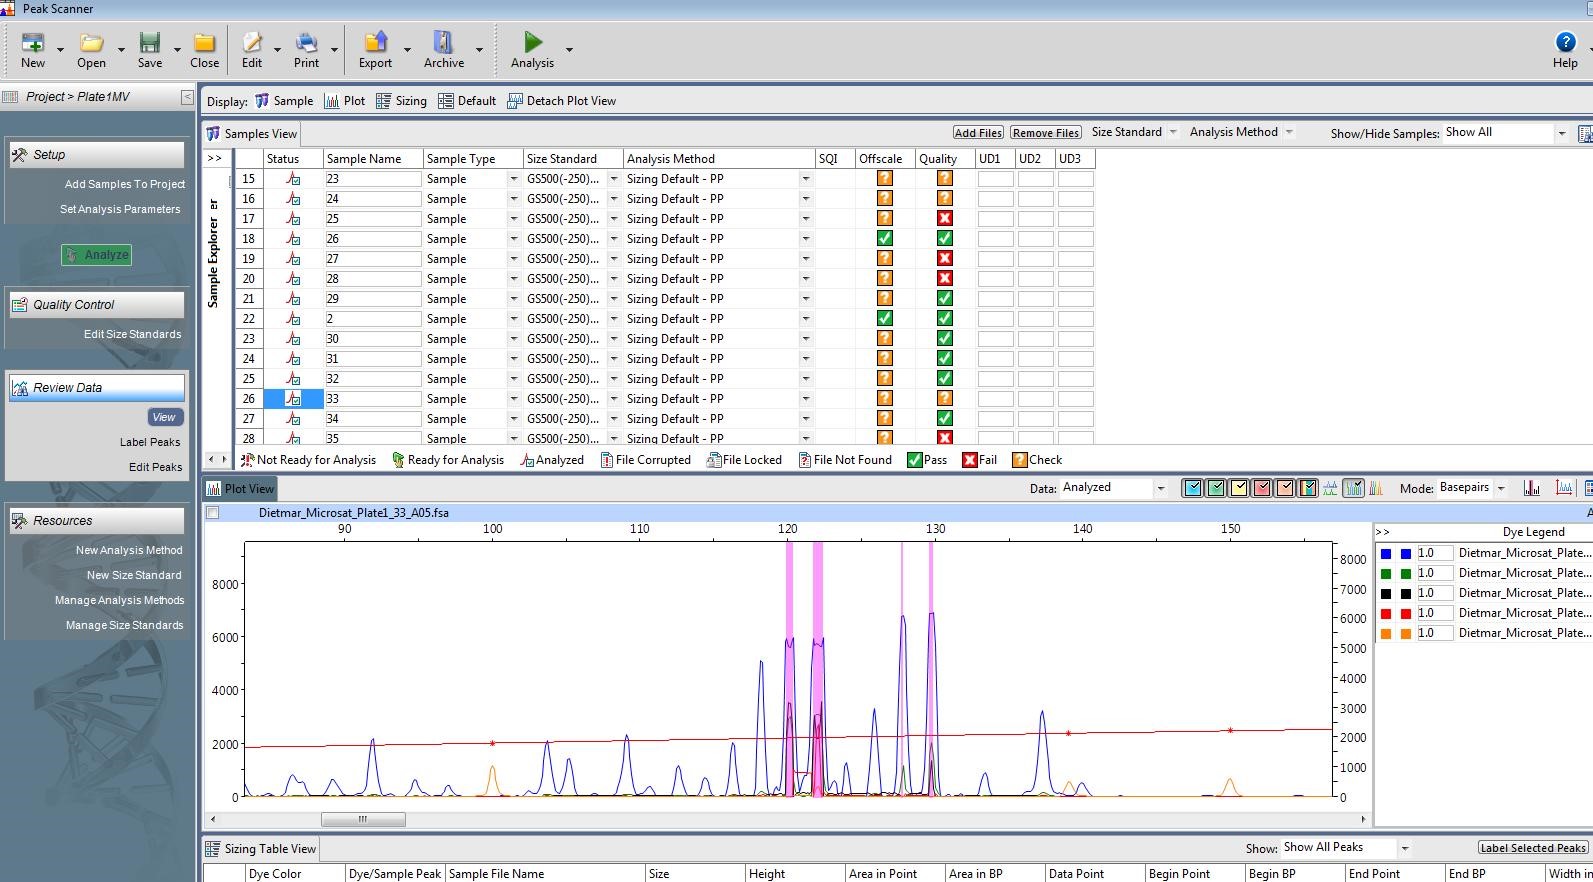
Too much DNA. The orange peaks are still the size standards. The blue peaks are the DNA from my sample. As you can see, the blue peaks (in the appropriate size range, 199-120 bp) do not have sharp points on top. This
means the length estimate for DNA in that size range is not accurate. Photo by M. Voelker.
As you might have guessed, getting the proper concentration of DNA in my samples to allow the capillary sequencer to work properly is something I have struggled with. But, progress has been made! Observe:
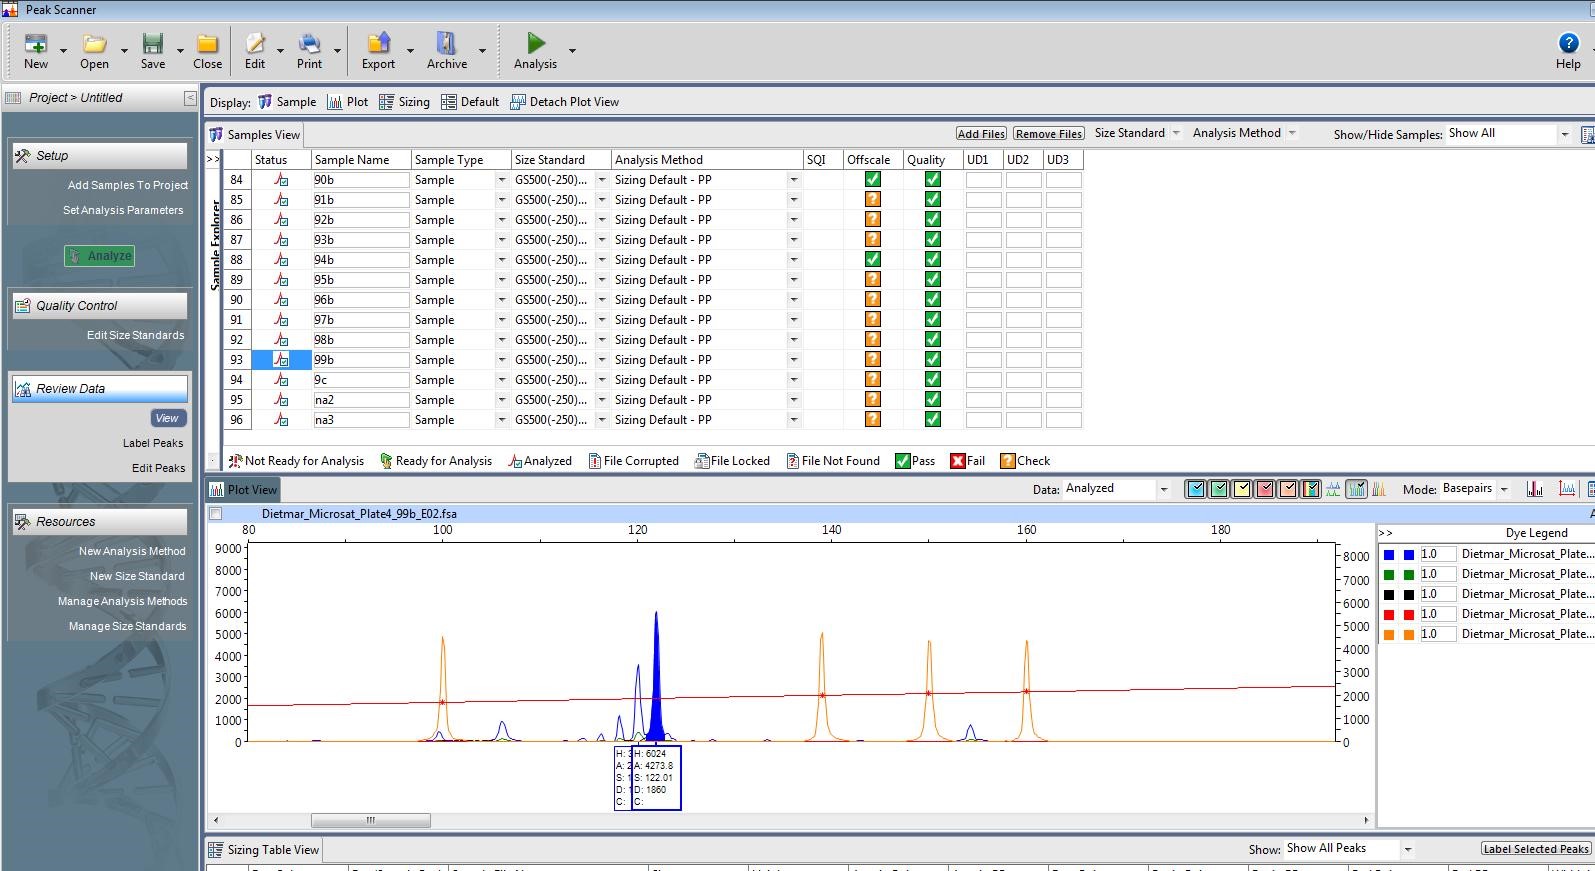
Goldilocks would like this one. I can clearly see that the length of this microsatellite is 122 base pairs (see the highlighted peak). The peaks to the left of the highlighted one are an “echo” caused by
polymerase slippage during replication. Photo by M. Voelker.
Thus far, this machine has been an interesting challenge. It is finicky and frustrating, but also very exciting because it is able to give me numbers I can use in data analysis. So, I am going to keep trying for that goldilocks zone!
Humans and seals as a barrier to conservation efforts
MacKenna Newmarch, undergraduate student
1 August 2017
Hello mammal lovers!
I have been doing a whole lot of reading on Harbor Seals and their foraging habits and behavior and come across some very interesting material.
From a recent paper written by the Marine Mammal Research Unit at University of British Columbia, I learned that Harbor Seals tend to eat salmon species of conservation concern in the spring and summer months, like Chinook and Coho, while they eat species of lesser concern in the fall and winter, like Pink and Chum. This generally follows the timeline of the salmon runs with more Chinook and Coho heading to natal tributaries in the spring/summer, and Chum (like ours in Whatcom Creek) appearing in late fall. This is a conservation concern as Chinook (also eaten by our endangered resident Orcas) and Coho are the most endangered of the salmon species.
The most alarming aspect of these data are the overwhelmingly larger proportion of juvenile Chinook and Coho consumed overall by seals in the spring (Thomas et. al. 2017) even though research has shown Chum juveniles are in much greater abundance (Beamish et. al. 2012). This implies that Harbor Seals are choosing Chinook and Coho over other species with intent for reasons unknown.
We are aware that salmon have an extremely high mortality rate during the first four months after smolt ocean entry (Beamish et. al. 2010). This study points out that the juveniles eaten with higher frequency undergo seaward migration at ages greater than one year while Pink and Chum do so at less than one year. Therefore, there may be more energy to gain from juveniles that are older (Coho and Chinook) and larger than aforementioned juvenile species. The authors also mention the possibility of a bigger issue impacting the elevated numbers of all juvenile salmon being eaten by Harbor Seals, such as “smolts [being] physically compromised by pathogens, contaminants or food supply.” It is possible that juveniles would be more susceptible to these factors as less developed and therefore more vulnerable organisms.
The mention of contaminants piqued my interest, since I have been thinking about tying this aspect into our data, as mentioned last month. Contaminants entering the aquatic ecosystem is an issue about which I am unfortunately more pessimistic and therefore interested in researching, as it requires changing several everyday behaviors that often require spending money. Explaining this issue and the lengths to which one must go to prevent further damage leaves many peopl feeling conflicted and discouraged.
Some contaminants are particularly harder than others to prevent from negatively affecting marine life. For example, pharmaceuticals can enter the ecosystem through wastewater, as many treatment plants fail to remove compounds before releasing water back into the environment. In the foreseeable future, humans will always need to take pharmaceuticals for various medical reasons, especially with many diseases on the rise and the population booming. Telling Barbara she needs to quit taking antidepressants for the sake of the environment is never going to go over well.
This brings us to the next paper that greatly interested me, which focused on the effects pharmaceuticals have on Harbor Seals. The two drugs found to have the most significant negative impact on seals are naproxen, which is a common pain reliever found in Midol, Aleve, etc., and estradiol, a hormone used to treat symptoms of menopause. The study found that these compounds significantly reduced lymphocyte transformation, or to make things simple (I have not taken more than an introductory molecular biology course), are immunotoxic. Overall, this leads to altered resistance to pathogens and reduction in function of the whole immune system. This is especially a concern with rising ocean temperatures which have been observed to harbor (pun intended) increased prevalence of pathogens (Welch, 2014).
My interests are beginning to lie specifically in anthropogenic effects on Harbor Seals and possibly tying elements of these two studies together. How will the presence pharmaceuticals affect the number of seals we are seeing and how many individuals return to the creek every season? Will it affect the number of salmon they are catching? My next goal is to figure out what kind of data on local water quality is available for us to examine. I regularly use lab space in a local wastewater treatment facility to test samples from Chukanut Bay and hoping there is a possibility they examine this, or at least monitor what they are releasing into Bellingham Bay.
Stay tuned!
References
- Beamish, R.J. et al. (2010) Early marine survival of coho salmon in the Strait of Georgia declines to very low levels. Marine and Coastal Fisheries. 2:424-439. DOI: 10.1577/C09-040.1
- Beamish, R.J. et al. (2012) The synchronous failure of juvenile Pacific salmon and herring production in the Strait of Georgia in 2007 and the poor return of sockeye salmon to the Fraser River in 2009. Marine and Coastal Fisheries. 4:403-414. DOI: 10.1080/19425120.2012.676607
- Kleinert, C. et. al. (2017) Immunotoxic effects of single and combined pharmaceuticals exposure on a harbor seal (Phoca vitulina) B lymphoma cell line. Marine Pollution Bulletin. 118:237-247. DOI: 10.1016/j.marpolbul.2017.02.041
- Thomas, C. A. et. al. (2017) Harbor seals target juvenile salmon of conservation concern. Canadian Journal of Fisheries and Aquatic Sciences. 74:907-921. DOI: 10.1139/cjfas-2015-0558
- Welch, Craig. (2013, 1 December) Scientists say climate change means sicker world for marine life. The Sydney Morning Herald.
Scientific conferences - part II
Raven Benko, undergraduate student
1 August 2017
This month I attended the Joint Meeting of Ichthyology and Herpetology (JMIH) in Austin, TX and gave my first oral presentation at a scientific conference. The experience taught me a lot about how to navigate such conferences, what makes for a successful presentation, and how to make the most of the experience. I presented on work I had done in the field of larval fish biology during my time at the Northeast Fisheries Science Center in Sandy Hook, NJ. Crafting the presentation took a lot of hard work, time, and flexibility, as anyone who's anyone knows that stopping at a first draft is never the best idea. Everything from choosing the font to the color scheme to the pictures and wording took great care and if I went back to my presentation today, two weeks after the fact, I would likely change it substantially. Overall, I learned that making a presentation that is efficient, succinct, and engaging is a lot of work and nobody has a tried and true recipe to make it totally successful. That being said, my presentation went very well. With the advice, suggestions, and analytical support from my mentor, Dr. Chris Chambers, I had people asking me if I was in the middle of my graduate degree after the presentation!
The next lesson I learned, about what makes for a - possibly subjectively - good presentation, came while listening to the many other interesting oral presentations during the conference. The presentations that stuck with me throughout the sometimes mind numbing information flow that one is subjected to in a scientific conference were the ones that told a story. The presentations that were in the traditional "Introduction, Methods, Results, Conclusions" format (admittedly the format I used for my presentation) often became muddled with the many others that I listened to. But the presentations that had a personal story, told a journey, and allowed for the researcher's passion to flow through were much more engaging and memorable. Those are elements I am hoping to incorporate in my next oral presentation.
Finally, I was reminded of the importance of scientific conferences for making connections and reuniting with colleagues. Last summer I was fortunate enough to attend the Larval Fish Conference (LFC) as I was completing my research in NJ and many of the LFC members were present at JMIH this year. It was wonderful to meet up with people I had met before, solidify my contacts, and get advice for the next stage in my academic career. I even made several contacts who work at the Northwest and Alaska Fisheries Science Centers and learned of potential job opportunities continuing in the larval fish field for after I graduate from WWU and before I pursue a masters. The experience and JMIH, while daunting, was completely worth while and I would encourage any scientist in any stage of their career to attend as many conferences as they can. They are great environments for learning and becoming reinvigorated with science!