November 2017
Statistics: The scariest thing this Halloween season
Madelyn Voelker, graduate student
1 November 2017
One of the key goals of my thesis is to use statistical tools to compare the level of specialization between male and female harbor seals. As such, I have spent quite a bit of time figuring out the most accurate way to do this. There have been multiple “Eureka” moments during which I thought I had accomplished this. Unfortunately, I have discovered most of these moments to have been misconceptions. Even with the negative feelings I have had during this process, I think my struggles are a nice representation of how we build our knowledge. Thus, I would like to share a few key moments along this particular intellectual path. If nothing else, it will hopefully show others who are struggling with statistics that they are not alone!
The first metric which I thought would work was WIC/TNW. This is a niche partitioning metric develop in the 1960s (Roughgarden 1972). I assumed it would be a good choice because it has a lot of supporting literature and thus would be defensible and comparable to many other studies. The issue with this metric lies in the type of data it was built to use. Originally, it was intended to be used with continuous data (measurements that fall on a continuous scale). Diet data, like what I am working with, is discrete (data fall into categories) – uh oh! However, the Shannon-weaver index (a measure of species diversity) can be used to change diet data into a continuous variable. When I figured this out I thought I was home free. That is until I discovered this method overestimates specialization unless all prey items have equal availability (Bolnick et al. 2002), which is definitely not the case for seal prey. Alas! My plans were spoiled again. But I persevered and read up on other established metrics.
This was when I discovered Araujo’s E value. This metric for calculating specialization was developed much more recently (with statistical significance tests in mind) and was built to work with discrete data (Arajuo et al. 2008). Seems great, right? Unfortunately, the answer to that is no. Araujo’s E is designed to calculate specialization at the population level. Because I want to know the difference between the female and male seals I would have to treat each sex as its own population. This would not be accurate because specialization is calculated in relation to what the entire population is doing. Thus, when it comes to comparing the two sexes, I need another metric.
Luckily, there is a huge wealth of scientific knowledge readily available in the form of peer-reviewed articles. So back to the literature I went, where I found my latest golden child – proportional similarity (Schoener 1968, Feinsinger et al. 1981). As the name suggests, this metric calculates the proportional similarity between individuals and the population. It allows calculation of specialization values at the individual and population level, is built to work with discrete data, and can be used with tests of statistical significance. Wow! Hopefully this metric will hold up to further scrutiny. You will just have to read next month’s blog to find out!
References
- Araújo, M.S., Guimarães, P.R., Svanbäck, R., Pinheiro, A., Guimarães, P., Reis, S.F. dos, et al. (2008). Network analysis reveals contrasting effects of intraspecific competition on individual vs. population diets. Ecol., 89, 1981–1993.
- Bolnick, D.I., Yang, L.H., Fordyce, J.A., Davis, J.M. & Svanbäck, R. (2002). Measuring individual-level resource specialization. Ecol., 83, 2936–2941.
- Feinsinger, P., E. E. Spears, and R. W. Poole. (1981). A simple measure of niche breadth. Ecol.., 62:27–32.
- Roughgarden, J. (1972). Evolution of Niche Width. Am. Nat., 106, 683–718.
- Schoener, T. W. (1968). The Anolis lizards of Bimini: resource partitioning in a complex fauna. Ecol.., 49:704–726.
Importance of site access
Alisa Aist, undergraduate student
1 November 2017
Recently the team has been having trouble getting to the observation site by what we call port algae. We were given codes to unlock gates leading to the site so we can drive or bike close to the site; however recently one of the gates has not been opening with the codes we were given. I am currently in the process of figuring out the code for that gate with the Port of Bellingham. Until then we are accessing the site another way that takes a bit longer but at least we didn’t have to switch sites again.
Even as we are slightly inconvenienced by this situation, we are still able to continue our research. It has left me thinking how the situation would change if that gate was the only way we could access the site. Often researchers are given special access to areas that are restricted to the general public. To gain access can be a long and tedious process and for us it involves signing papers that outline exactly what we will be doing. Each person on this project has to sign these papers and if one of us messes up it can result in the whole group losing access to the site.
Access to locations and subjects is something researchers constantly have to think about. We want to be able to do our research but sometimes end up in not ideal conditions where the value of the data collected is questionable and then you are in a moral dilemma. To have all the time you put in not end up in a paper or have to consider that your trends might not be conclusive.

View of the study site from our new observation point. Photo by Alisa Aist.
As observations for this study have been ongoing for 10 years now the observation areas have changed and where we observe from is very different. These changes have mostly been in the last two years as construction has started and they have to move us to work. As we move forward it will be important to define the observation areas so that no matter where we are observing from the data will comparable from the beginning in 2007 to 2017 and on.
They are just like us...a little different: examining the possibility of seal personalities
Mackenna Newmarch, undergraduate student
1 November 2017
Last month I made the decision to hone in on the possibility of Harbor Seals displaying behaviors that are unique to each individual. I have chosen to quantify these varying behaviors by examining specific foraging habits we have seen and finding how they might result in success. In doing so, I can demonstrate that certain behaviors prove more useful to some than others or, inversely, prove there is no variation in behavior. Now that that the hard part is out of the way, research on similar topics has ensued, and boy, what a treat!
A very recent study looked at foraging behavior, movement patterns, and diet composition to determine individual behaviors (Carneiro, 2017). Findings supported the idea that seals behave differently, pointing out that this is helpful in preventing interspecific competition as individuals can fill foraging niches. This paper also suggests seals return to the same area for foraging because they are familiar with the feeding conditions and resource availability. This is certainly observed in Whatcom Creek and it is an individualistic habit in and of itself. It is stressed throughout the text that repeatability is an often overlooked but extremely important element to consider in experiments of this nature. Luckily, since our dataset ranges from 2011-2017, we have plenty of repetition if the seal returns to the creek several times, which we know many if not most do.
Another recent study had a similar question but focused more on how behaviors varied with presence or absence of anthropogenic noise and used fractal models to do so (Seruront and Cribb, 2017). Fractals are a method that is convoluted to me, but essentially allow us to assess movement and complexity of behavioral patterns. This is a budding method of behavioral analysis in marine mammalogy. The study, which looked at both Harbor Seals and Grey Seals, found that diving and surfacing patterns were significantly variable for Harbor but not Grey seals.
In an older study (Hastie, 2000), researchers attached radio tags to six male harbor seals that would send signals when a seal surfaced. This data were categorized into display dives (dive 60s, surface intervals 1-30s) and longer dives (dives 200s, surface intervals 20-60s). The latter were associated with traveling, foraging, or resting.
If we were to examine dive lengths, since we don’t have access to expensive equipment like radio tags, we can rely instead on our surfacing event data and photo identification to pinpoint how long a seal spends diving and surfacing. If we define longer dives as being a sign of foraging, we can attribute percent of the time at the creek spent foraging with the success rate of hunting. We eliminate the possibility the seal is traveling or resting by exclusively considering data that provides evidence for hunting (i.e. surfaced on back looking underwater, observed rapidly swimming underwater on bank, wake in creek where seal is rapidly following a fish, etc.)
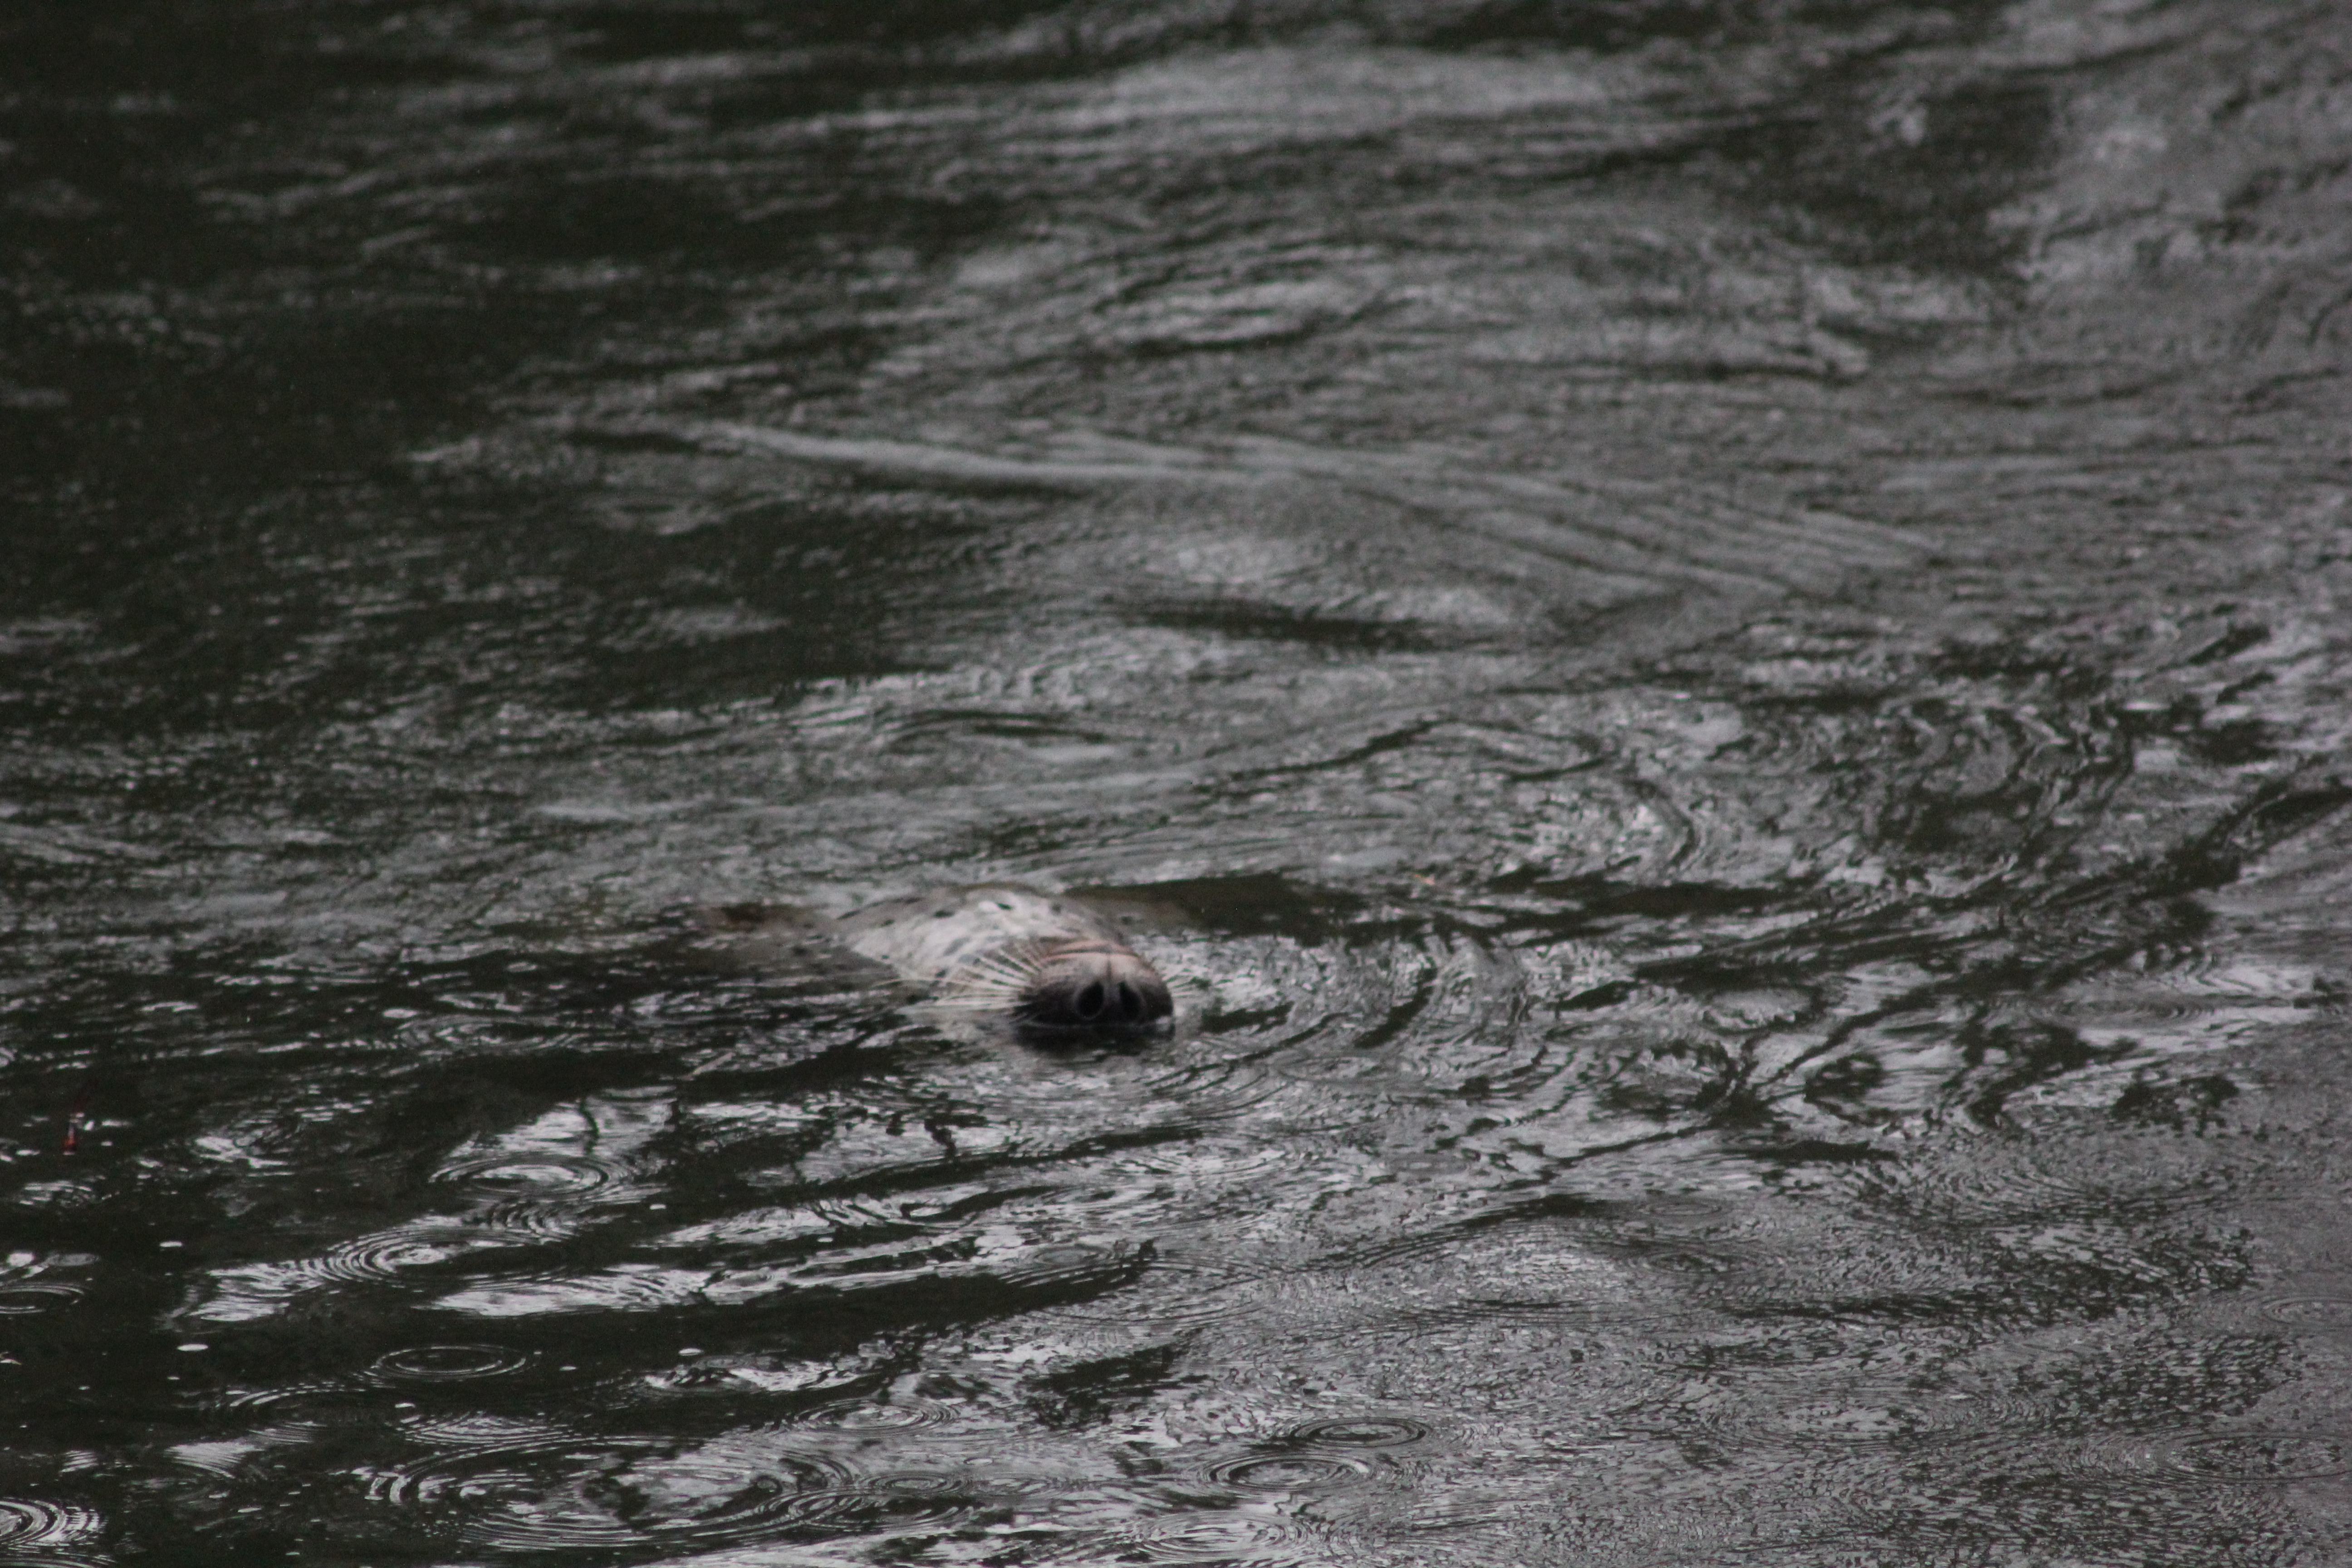
Seal getting a better view underwater. Photo by Mar. Mamm. Ecol. Lab.
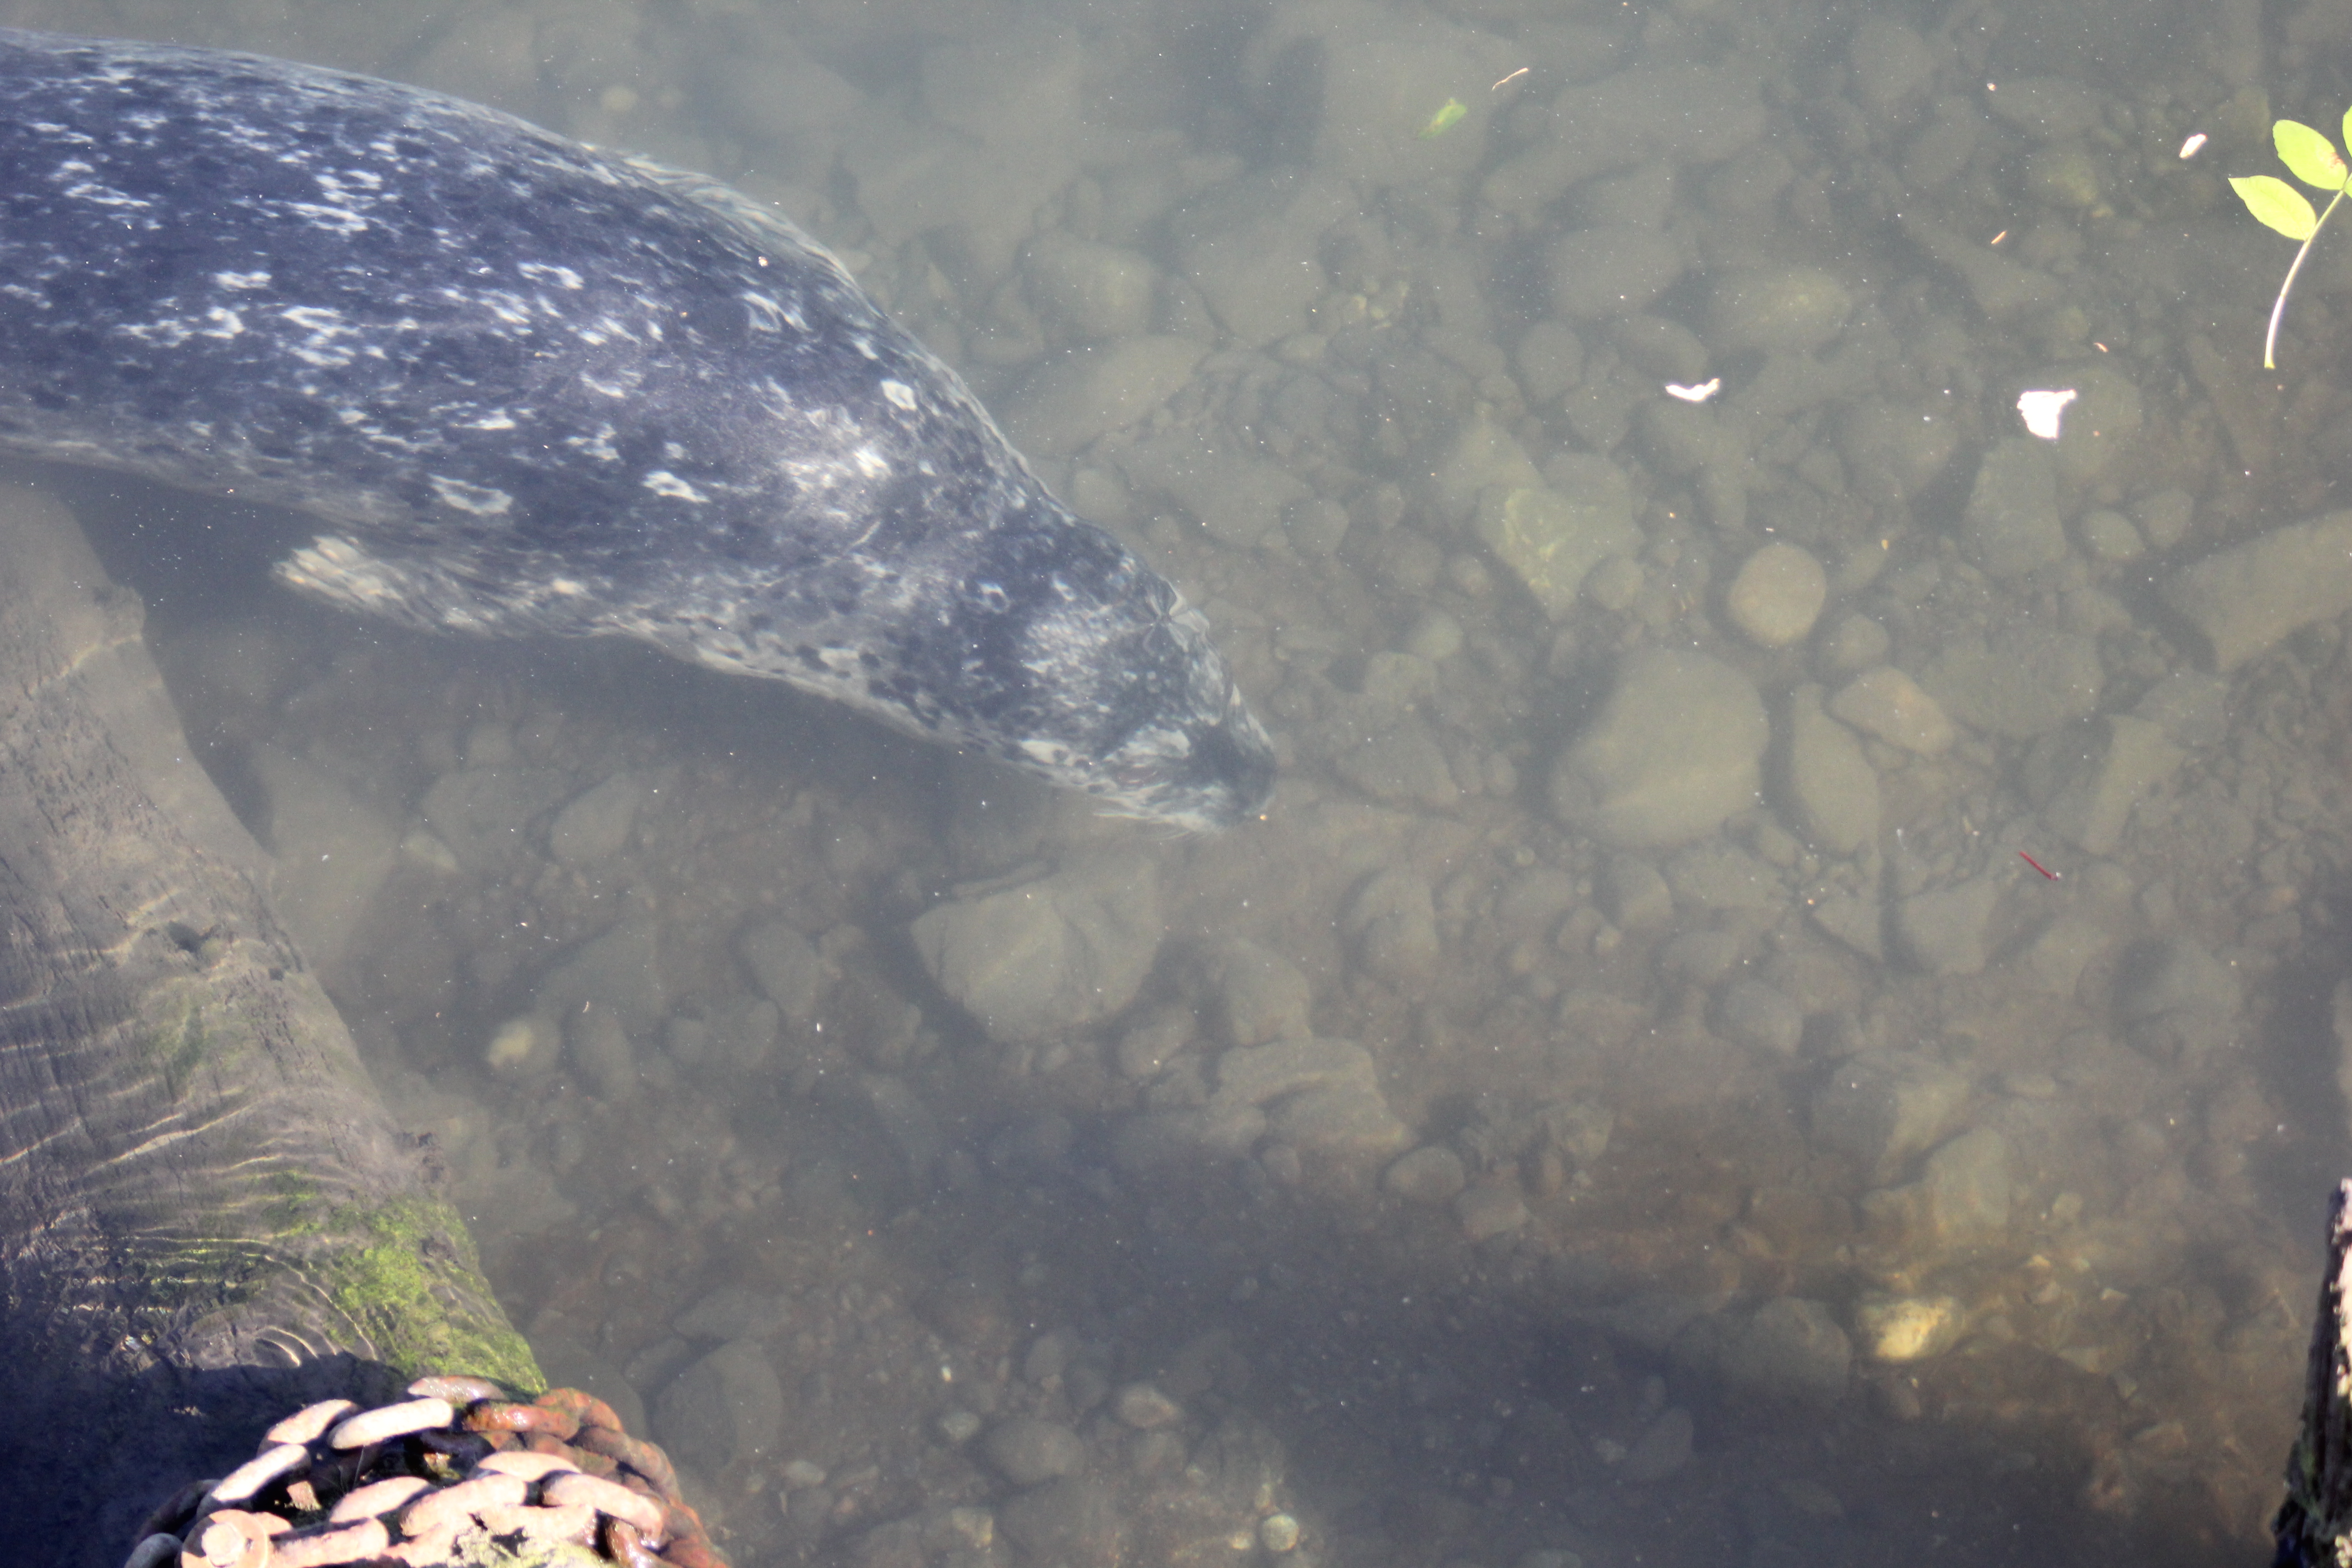
Seal foraging on bankside. Photo by Mar. Mamm. Ecol. Lab.
These studies and several others are proving to be invaluable as I begin to refine my methodology. This being the first time I have ever had to form a research question with next to no knowledge on a study of this type, previous research will be especially useful.
References
- Carniero, A. P. B. et. al (2017) Methods for detecting and quantifying individual specialisation in movement and foraging strategies of marine predators. Marine Ecology Progress Series 578: 151-166. DOI: 10.3354/meps12215
- Hastie, G. D. et. al. (2000) Individual and geographical variation in display behaviour of male harbour seals in Scotland. Animal Behavior 59: 559-568. DOI: 10.1006/anbe.1999.1307
- Seuront, L., Cribb, N. (2017) Fractal analysis provides new insights into the complexity of marine mammal behavior: a review, two methods, their application to diving and surfacing patterns, and their relevance to marine mammal welfare assessment. Marine Mammal Science 33: 847-879. DOI: 10.1111/mms.12399