August 2018
Back to Bellingham
Madison McKay, undergraduate student
1 August 2018
Sadly, I came home from Mexico a couple of days ago and I am now back in “the ham”. While I do miss the constant heat, sunshine and warm waters, I am glad to be back and I am ready to see my seal friends again.
During the last two weeks of studying in Mexico I was able to work on an independent project that consisted of creating a question, figuring out how to test it, collecting data and analyzing the results. This experience was fast paced, but taught me the steps necessary to create a research question of my own. I am excited to apply these skills to developing a question regarding the hunting behavior of our harbor seals.
Using my observations from this past year has given me inspiration of where I would like to start. I am interested in continuing to observe the success of hunting behaviors, but would like to potentially bring in another factor. I know that there is a large variety in the frequency of seals showing up to hunt on any given day. I am wondering if hunting success depends on the number of seals present. My thought is that as the number of seals increases, the success of any given seal may decrease due to more competition.
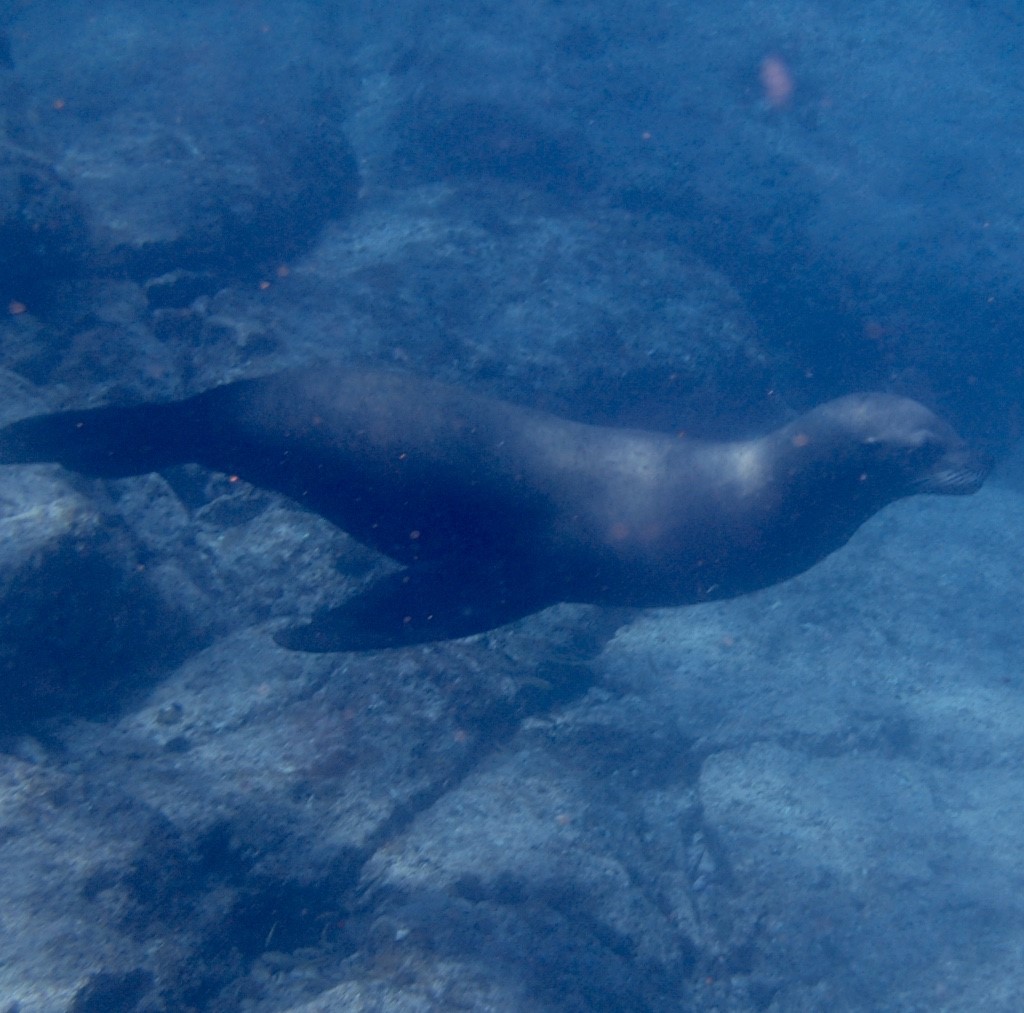
While in Mexico we had the privilege to snorkel with a colony of California sea lions. Similar to my observations of the seals in Washington, the colony would haul-out in groups, but would hunt individually in the
water. Photo by M. McKay.
In order to narrow down my observations to a well-thought and testable question I need to consider all of the variables involved. It is possible that the seals use certain behaviors that are more successful when there are more individuals present. In this sense, I could focus on the specific behaviors being used and compare this to the frequency of seals. I may also need to look at other factors that can affect the number of seals present on the day; this could include weather, hatchery data, fishermen, tide, etc. Although I still have a lot to think about, I am ready to get to work and feel extremely motivated to start conducting my own research!
REU updates
Wyatt Heimbichner Goebel, undergraduate student
1 August 2018
It is currently week seven of the nine week REU program that I am participating in here at the Oregon Institute of Marine Biology. As such, I’d like to give you some updates about my project, which is just about complete at this point. As a reminder, I have spent the summer studying a ctenophore jellyfish, Pleurobrachia bachei, that is abundant in the Pacific Northwest. I was particularly interested in the swimming performance of this organism with respect to how the beat frequency of the ctenes, their primary swimming structure, relates to their swimming speed.
I’m happy to report that I got great data and the results were consistent with my hypotheses. Below you can see plots of beat frequency compared to normalized swimming speed, which is swimming speed divided by body length, and beat frequency compared to absolute swimming speed. I normalized the speeds to the organisms’ body lengths due to previous results that showed a positive correlation between body length and swimming speed in ctenophores (Matsumoto 1991).
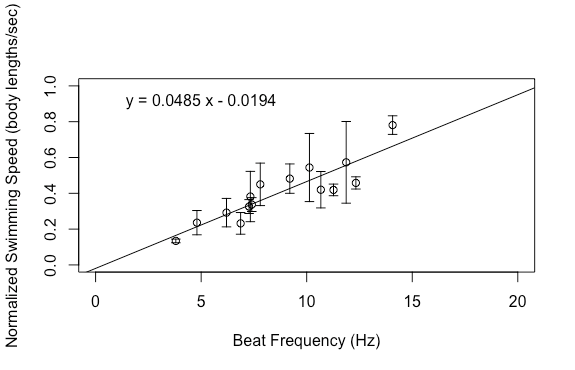
Figure 1. Mean beat frequency compared to mean normalized swimming speed in P. bachei (n=15). Each circle represents one individual. Normalized swimming speed significantly increases by
0.0485 body lengths/sec for every one hertz increase in beat frequency (F1,13=49.97, P=8.428x10⁻⁶, r2=0.7936). Error bars represent 95% confidence intervals. Horizontal error bars excluded for clarity.
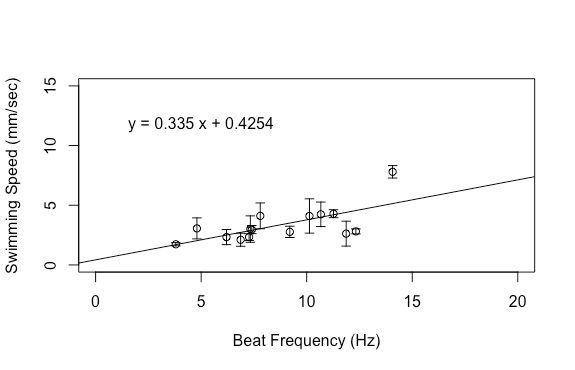
Figure 2. Mean beat frequency compared to mean swimming speed in P. bachei (n=15). Each circle represents one individual. Swimming speed significantly increases by 0.335 mm/sec for every one
hertz increase in beat frequency (F1,13=10.36, P=0.006725, r2=0.4434). Error bars represent 95% confidence intervals. Horizontal error bars excluded for clarity.
Based on the above graphs, beat frequency has a large effect on the swimming speed of these organisms. As the beat frequency increases, swimming speed significantly increases regardless of whether body size was accounted for. However, the size of the organism does influence their swimming speed, as beat frequency is more strongly correlated to normalized swimming speed than absolute swimming speed. This is consistent with previous results from Matsumoto 1991, but also shows that beat frequency is one of the primary drivers of swimming speed in these organisms.
I also looked at their morphology to see if I could gain any insight into why the above trends occur and found that there are significant increases in nearly every morphological metric related to the ctenes as body size increases. There may be a connection between the increases in morphological metrics, such as the length of the ctenes, and the swimming speed trends seen above, but the morphological variables and kinematic variables were not directly connected in my project.
I’ve quite enjoyed my time at this REU; it has honestly been one of the best experiences of my life so far. It’s validating to know that I enjoy doing research since I am currently planning to pursue marine biology as a career. As my time here ends, I am looking forward to returning to Western and starting my seal observations again.
My last blog
Madelyn Voelker, graduate student
17 August 2018
Great news! I successfully defended my thesis on August 6th! Which is why this blog is a bit late to the scene. It was a very exciting and fulfilling event (and a bit stressful too!). And there is more good news, I’ve taken a job as an eDNA technician at the Rocky Mountain Research Station in Missoula, MT. All in all, this is a very busy and transitional time in my life. But as I feel myself hurtling forward, I want to take quick look back at my time in graduate school.
As a graduate student I learned more things than I can list in this blog, so I will try to focus on a couple that I think are especially valuable to try and pass on as advice. First, plan ahead, and actually make (write it down!) a detailed plan. For a research project this should cover background literature, sampling design, labeling and processing the samples once you have them, all they way through any statistical analysis. You also do yourself a huge favor by then doing your best to tear the plan apart. Where are the logic holes? What could go wrong? This might help you prepare for INEVITABLE failures in your design. Failures in a project don’t make you a bad scientist – they just make you a scientist. Projects almost never go as planned, but by reviewing your ideas, and adjusting accordingly, you might avoid some issues. Something that goes along with this is the ability to keep trying, and not lose confidence in your ability. Like I said, there will be bumps in any project. But, I think one thing that differentiates very successful scientists is their ability to adjust to failures and come back better than ever (learn from your mistakes!). Both of these pieces of advice are mindsets I cultivated during graduate school that I hope to continue building on in the future – I think it’s worth it!
In conclusion, my time as a graduate student at Western Washington University has caused me to change and grow, I think for the better. The last 2(ish) years have been hard, but SO fulfilling, and I am very happy I made the decision to return to school to earn my Master of Science.