February 2018
Sex ratios
Madelyn Voelker, graduate student
1 February 2018
My last blog discussed the importance of seal sex with regards to the level of specialization. However, the effect of sex on the level of specialization is not the only interesting information that can be gleaned from the collected sex data. Within the Salish sea sex ratios within single haul-outs are known to vary by location and time of year. Additionally, it has been suggested that males and females eat different prey items. Further, based on the analysis introduced in my last blog, the level of specialization likely changes differently for each sex throughout the year. Thus, different sex ratios could cause differences in how a population of seals effect their prey populations. So, I thought it would be worth-while to examine how the sex ratios at each location varied.
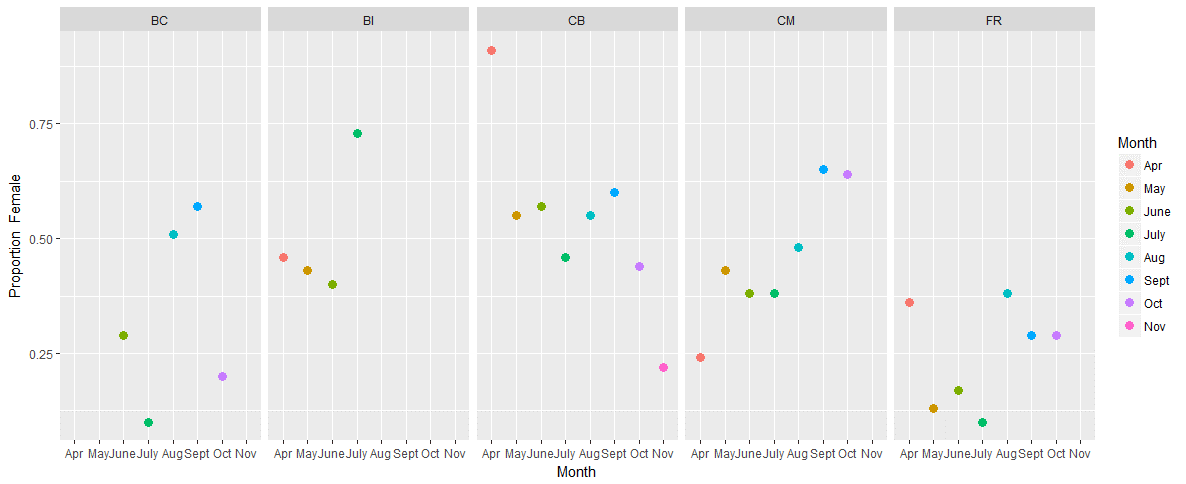
The sex ratios at locations that were sampled during this project supported the idea that the ratio varies by location and time of year. Extreme ratios (above 75% of one sex) were seen at all locations except Baby Island. The highest ratio of females (91%) was documented at Cowichan Bay in April while the highest ratio of males (90%) was documented at both Belle Chain and Fraser River in July (Figure 1). However, even with these extremes, there does seem to be some semi-consistent patterns. At most sites the highest ratio of females was seen during the months of August and September (Figure 1). This pattern potentially stems from the fact that females give birth and ween pups during the months of July and August in this region. During this period, females are known to spend more time hauled-out. Thus, it would make sense if it was more likely for a female to defecate on land at this time of year. Interestingly, this complicates the interpretation of sex ratios because you don’t know if the higher ratio of females detected is an artifact of females spending more time at the haul-out, or if it is an actual shift in the ratio of the local population. I don’t have an answer for that right now – but as always, more interesting food for thought!
How to have random samples
Alisa Aist, undergraduate student
1 February 2018
Ensuring that samples gathered are random is very difficult. When your research involves picking which sea stars to sample a research might have to time their work with the tide, have a way to label them with numbers and then randomly generate the numbers to check. Sometimes researchers are unable to be selective with their samples because they are studying say whales, that swim away, dive deep, and there are not many of them. However, sampling randomly is the basis for how we can predict the results for a population without testing every single individual in the population.
When a researcher is looking at people they have to send out surveys, knock on doors, or question people in social spaces. Because people have the right to not answer the survey the data is biased to those who are more inclined to take the time and respond. For instance, a researcher might decide to go around and knock on doors, but if they only do this during the day before 4 or 5 o’clock then they will miss the working population of that area, perhaps biasing the data to older retired people who are home during the day.
These are some of the challenges that I am finding come up a lot in research done via surveys. In one study the researchers decided to pick who they were going to interview by dividing up the population in whose answers they were interested into groups and interviewed the core members (Tonder and Jurvelius 2004). The goal was to reduce the number of people who had to be questioned while still recording the main ideas of the people regarding how they felt about the conservations efforts aimed at the Saimaa ringed seal. Tonder and Jurvelius (2004) were only able to do this because they knew their sample population well as it was quite small, only 2500 cottages.
Langford et.al. (2001) had a much larger sample size when they did research on fishermen’s opinions on the Mediterranean Monk Seal. They picked a middle-sized city in the Aegean Sea: Mytilini. It was not possible for them to survey all the cities so they picked one thought to be in the middle in demographics and in stages of development. From there, they decided to focus on fishermen who were randomly selected from a list held by the local authorities. This made the sample size manageable and they were able to target the population they really had questions for.
Solutions to the biased survey problem are tied very close to what question you want answered, then there are ways to try and ensure as much as you can that the data collected are unbiased. Tonder and Jurvelius (2004) wanted to ensure that they asked people from the five main interest groups they identified. Langford et. al. (2001) wanted to ask the fishermen themselves what they thought of the proposed plan to reimburse them for not killing the seals.
References
- Langford, I. H., Skourtos, M. S., Kontogianni, A., Day, R. J., Georgiou, S., & Bateman, I. J. (2001). Use and nonuse values for conserving endangered species: the case of the Mediterranean monk seal. Environment and Planning A, 33(12), 2219-2233.
- Tonder, M., & Jurvelius, J. (2004). Attitudes towards fishery and conservation of the Saimaa ringed seal in Lake Pihlajavesi, Finland. Environmental Conservation, 31(2), 122-129.
Research question
MacKenna Newmarch, undergraduate student
1 February 2018
This month I have been focusing on honing in my research question and methods while deciding why they are significant. This will be particularly helpful as I begin to write my first ever grant proposal for some new camera equipment. Though needing some refinement, my question is as follows: How do behavioral factors affect foraging success in Harbor Seals at Whatcom Creek Salmon Hatchery?
This question will examine attempts that seals make to hunt (as defined by the five behaviors I outlined last week) and how these efforts might result in differing foraging success. I will be using our behavioral and photo ID data from 2011 through 2015 (hopefully through 2016 by the time I prepare my poster). With the behavioral data, I will control tide level and location in the creek and whether Chum salmon are known to be running or not. When analyzing the data, I plan to use generalized linear mixed models to see if the frequency of a feeding behavior is related to the success rate of an individual.
No study has examined foraging succeess relative to hunting behavior in harbor seals so I am not quite sure what to expect. However, I do expect to see outliers in that some individual seals may be more successful than other, as many studies have indicated that pinnipeds can exhibit individualistic behavior ( Hastie et al. 2000, Carneiro et al. 2017; Seruront and Cribb 2017 ). I also expect that seals with impaired vision, which we can see easily in photos, will have less success with hunting behaviors than seals without impaired vision.
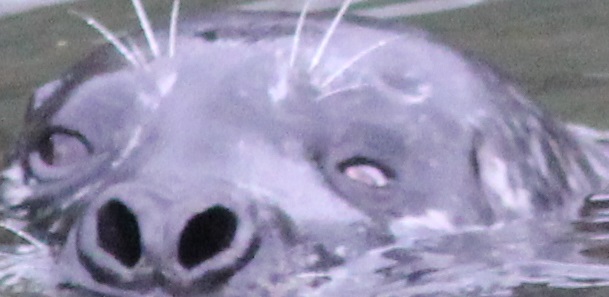
Seal 4 with damaged left eye. Photo by Marine Mammal Ecology
Lab.
Though I may not have enough data to examine the difference between vision-impaired and normal-vision seals, I may be able to explore differences among individuals. For example, last month we saw in my p that one seal has caught a salmon each of the five times they have visited but another has caught no salmon in all of his 40+ visits. I have not yet been able to determine what might cause this wide variation, but if we find that one seal has become somewhat of a “master” at a certain hunting skill observed before he has caught each fish it will certainly be worth discussing.
These data will be important as we continue to monitor seal behavior in the future. With increasing human development near the creek from the Whatcom Creek Restoration Project and all that is sure to come with Bellingham’s increasing population, we can use these data as a baseline study for our sub-population of harbor seals’ behavior. If we notice changes as development increases, this will clue in to the potential negative effects of population growth on marine mammals and beyond.
Additionally, though still being studied by past lab members, if we discover that there are rogue seals who eat more salmon than others, this study could help us define behavioral characteristics of a rogue individual. Ecologically and economically this information is valuable as these bold individuals can impede on expensive endangered species restoration efforts. If we find a quick way to determine whether a seal is rogue or not by creating a predictive model based on our data, we could save time and money by not having to watch a seal closely over a long period.
Hopefully I will have some new insight by next month. Meanwhile, enjoy an amazing photo of our seals taken by a local nature photographer.
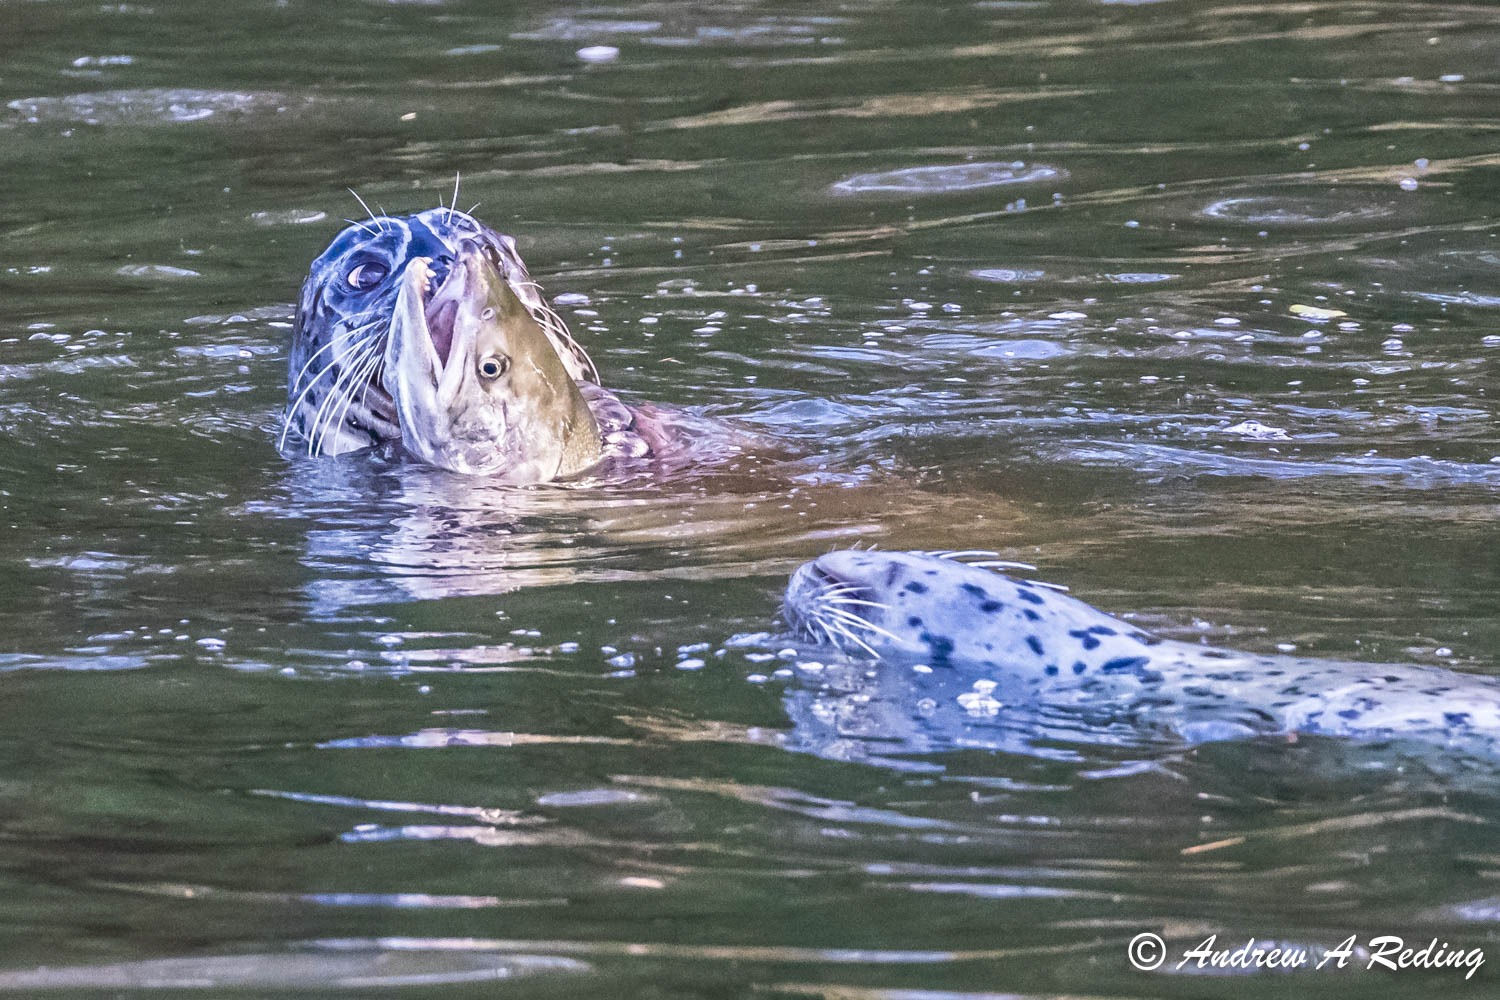
Seals feeding on salmon at Whatcom Creek. Photo by Andrew
Reding.
References
- Carniero, A. P. B. et. al (2017) Methods for detecting and quantifying individual specialisation in movement and foraging strategies of marine predators. Marine Ecology Progress Series 578: 151-166. DOI: 10.3354/meps12215
- Hastie, G. D. et. al. (2000) Individual and geographical variation in display behaviour of male harbour seals in Scotland. Animal Behavior 59: 559-568. DOI: 10.1006/anbe.1999.1307
- Seuront, L. and Cribb, N. (2017) Fractal analysis provides new insights into the complexity of marine mammal behavior: a review, two methods, their application to diving and surfacing patterns, and their relevance to marine mammal welfare assessment. Marine Mammal Science 33: 847-879. DOI: 10.1111/mms.12399