May 2017
Struggling with data
Raven Benko, undergraduate student
1 May 2017
One of the experiences that comes along with learning how to do science is struggling organizing and analyzing data. I find working with data to be very rewarding - not necessarily the inputting and organizing on an excel spreadsheet, but when you get to the point where your data is ready to use analysis software, the activity turns into a challenging and complicated puzzle. Maybe that doesn’t sound very fun, but when you’re just starting out there is a world of knowledge that opens up to you and I’ve always loved to learn.
As I am currently working with my data to present at the upcoming Annual Meeting of the Student Chapter for the Society of Marine Mammalogy at the University of British Columbia I figured I would share my struggles with coding in the analysis program R and formatting my data. I will try to keep it as interesting and entertaining as possible!
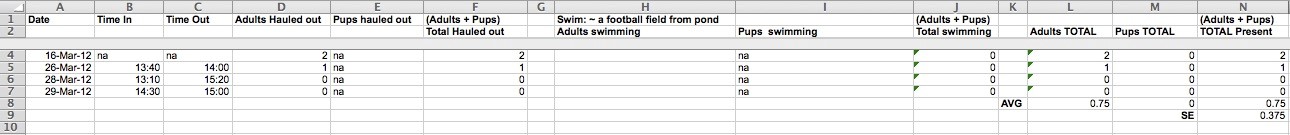
The first step to working with data is formatting it in a way that your coding software can recognize. In R, that means the first row of your data sheet must contain all of the column names for the different data types you have. The column headers must also be written without any spaces or strange characters in the name. For example:, the column with information on “Total Adults Swimming” would have named something like “Total.Adults.Swimming”, or more simply, “AS_Total” (both periods and underscores are special characters that R recognizes). There cannot be random cells missing data or empty rows in the data sheet. This means my data sheet went from looking like this…
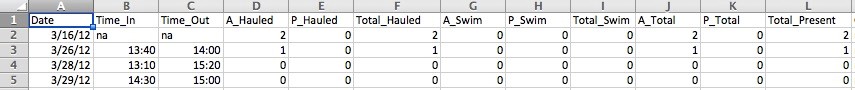
To looking like this:
After many hours reformatting my data and double checking that there weren’t any errors, empty cells, or incorrect equations, I went on to coding in R to attempt to create a graph showing the monthly average seal abundances across our 7 years of data and overlay all of the construction activities that have occurred. Below is a sampling of my struggles with R.
The coding language may be foreign, so pay attention to the lines beginning with multiple number signs. If you place a number sign at the beginning of a line of code in R, the system will ignore that line, meaning I can write notes to myself about what I was trying (an failing) to accomplish.
Step 1: Import my dataset into R and try a simple date vs. abundance plot.
Code:
##### Log Pond Abundances through April 2017####
seal.data<-read.csv("Log Pond Reformatted_R Ready.csv")
attach(seal.data)
seal.data[order(as.Date(seal.data$Date, format="%m/%d/%Y")),]
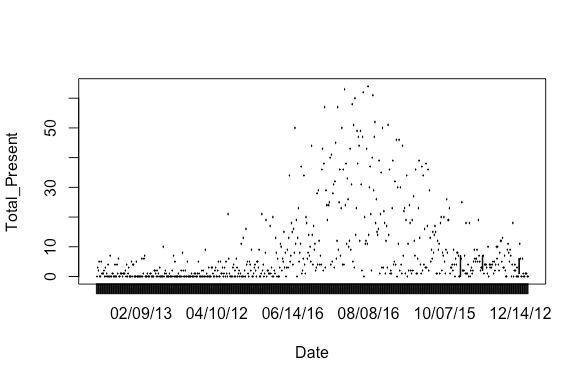
plot(Total_Present~Date)
Results: A plot with the dates out of order
Step 2: Order the dates correctly. Use package ggplot2.
Code:
####Not working, dates not in order. After doing some online research, the order
functions should look like this
dts<-seal.data[,1]
dts<order(as.Date(seal.data$Date, format="%m/%d/%Y")),]
qplot(x=dts, y=Total_Present, data=seal.data)
Result: This really made R angry and it had trouble rendering the graph, probably because I was asking it to make a graph from over 600 individual observations and it was too much to process. That’s just my guess, I’m no expert.
After all of this work, I realized I wanted to look at the monthly abundance averages as opposed to trying to plot every single observation on one graph. This involved me moving my data around and creating a new sheet with the information I wanted to graph. I then began struggling with R again, and had similar results. I made an appointment with our local R expert and statistical wizard Dr. Ben Miner in WWU’s Biology Department. I’m sure he will be able to fix the novice mistakes I have been making and teach me how to create this seemingly simple plot. All in all, I’m definitely going to make an effort to study more statistics and coding in graduate school.
Do harbor seals show foraging site fidelity to Whatcom Creek?
Rachel Wachtendonk, undergraduate student
1May2017
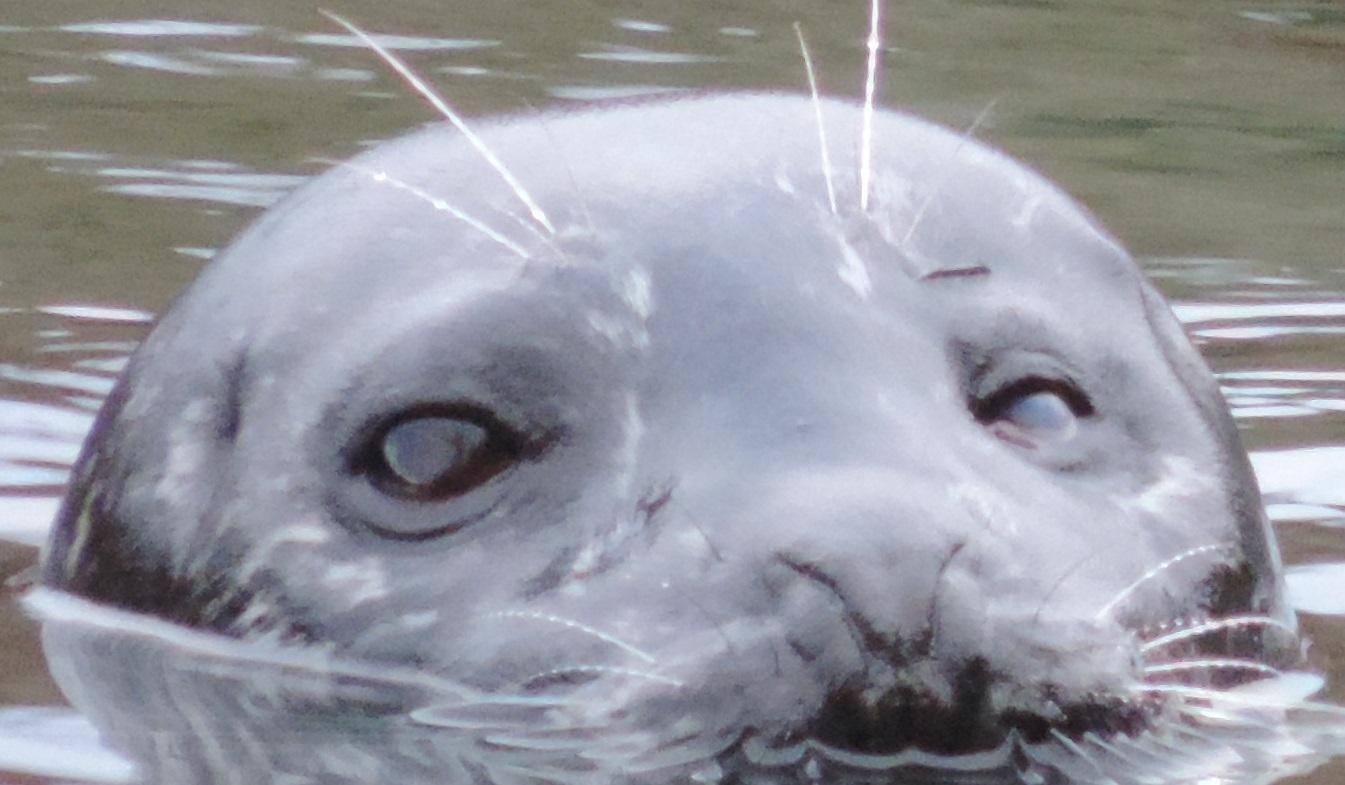
After many hours in the lab, we have finally identified all of the seals through fall 2015. I still have to match these seals to the surfacing events that indicate foraging success to determine the relative success of each seal, but this is what we know so far. From the very start of the project in 2011, we have identified 155 seals, 65 of which were first seen in 2015. We do get re-sightings of the seals, with the average being 3.25 times per seal. However, the seal that has frequented the creek most has been seen on 56 different occasions! Only 75 of the 155 seals have been seen at Whatcom Creek on more than one occasion. This means that in a given year, most of the seals seen will be new seals.
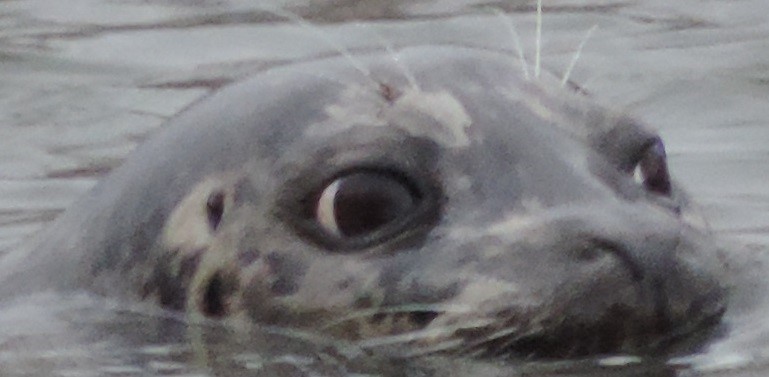
Seal 0012, our most sighted seal. Photo by Marine Mammal
and Ecology Lab.
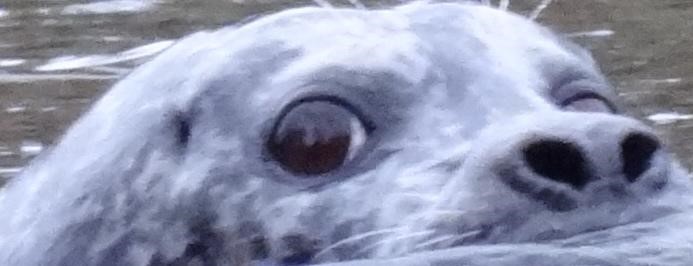
We have also found that most seals that do return are only seen on one or two days during a given season, most often in fall and winter. The most times we have seen a single seal in a given season was in fall 2015, where one seal was seen on 18 days from September-November, way more than the average.
Seal 0004, who was seen on 18 different days in Fall 2015.
Photo by Marine Mammal and Ecology Lab.
I also find it interesting that, on first glance, there does not seem to be a pattern to when we see certain seals. Most seals that we see come in the fall and winter, which makes sense as we believe that they are coming to forage. Some seals are seen every salmon run once they appear at the creek, like seal 0004 pictured above. Other seals are seen for a year or two and then are never seen again. And then some seals are seen for a few years, not seen for a year or two, and then show up back at the creek. Like seal 0009, who was first seen in winter 2011. 0009 was seen in every fall and winter season except for 2013.
Seal 0009. Photo by Marine Mammal and Ecology Lab.
So we do have seals that show fidelity to foraging at Whatcom Creek, but do any of these seals take more than their fair share of the salmon? I am excited to figure that out soon.
Hard-part processing
Madelyn Voelker, graduate student
1 May 2017
One of the tasks I am completing for my thesis is processing prey hard parts from all of the scat samples. The reason this process is referred to as “hard-part analysis”, and not just “bone analysis”, is because harbor seal prey have hard parts that aren’t bones! For example, harbor seals eat cephalopods (squid and octopus), which have beaks. Beaks are the hard mouth piece cephalopods use the help break up their prey – the aren’t technically bones. Additionally, eye lenses often make it through the digestive process as hard pieces. Thus, we have hard part analysis!
Hard part processing is an interesting and fairly involved endeavor. The scats were initially collected into mesh bags within histoplex containers. Within the histoplex containers, all of the scat were processing to remove a representative sample of DNA for molecular diet analysis (this is already finished, yay!). This left us with mesh bags full of mushed-up scat (lovely!). The left-overs in the mesh bag is where the hard part processing starts. The first step is to zip-tie the mesh bags closed, with a waterproof label included. The scats are then sent through a washing machine three times. Don’t worry, we have a washing machine designated for scat! After that, the scat are allowed to dry – and then the really fun part starts. The mesh bag is emptied out into a set of nested sieves. If I am lucky, that looks something like the picture below.
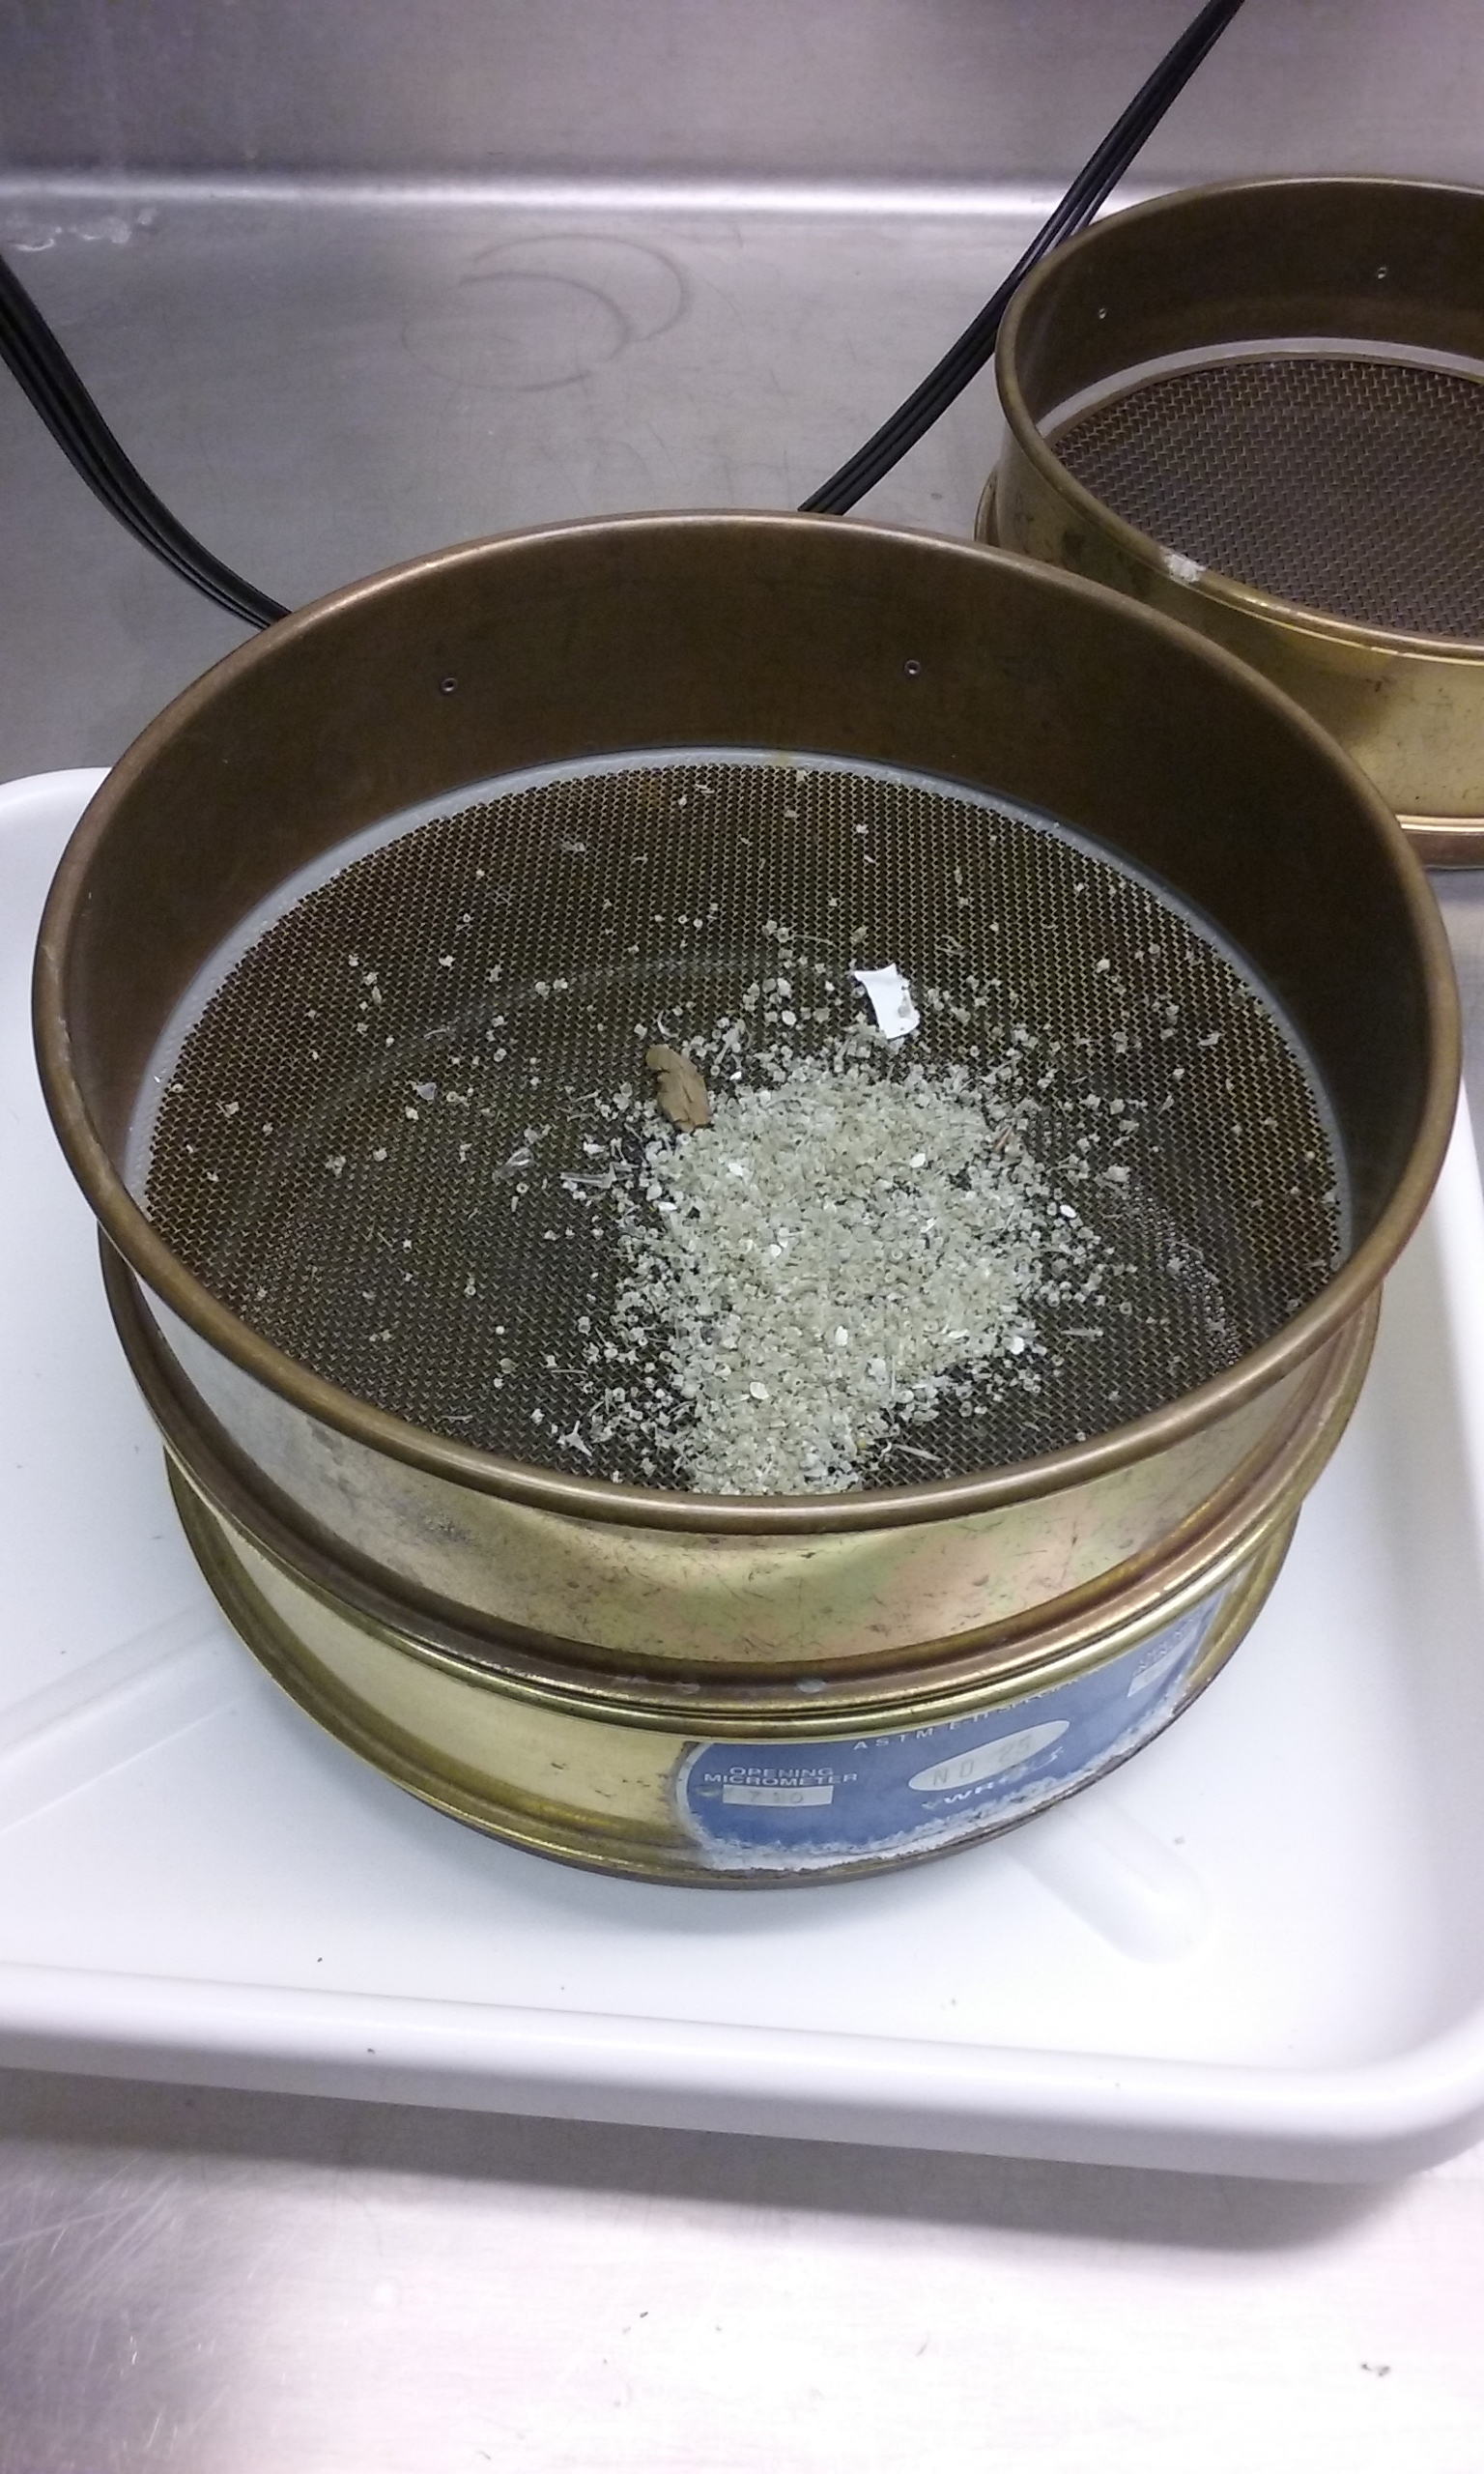
Photo by Madelyn Voelker
This scat is relatively clean, and is mostly bones. However, because a lot of the scat was collected off a shell beach, some samples are more 50/50 bone/shell. Those samples are not so much fun…The sample is worked through the set of sieves until all debris is removed. All hard parts are then transferred to a scintillation vial (which is just a fancy way of saying tiny glass jar) with a mixture of ethanol and water. If I’ve done a good job, this looks like the picture below:
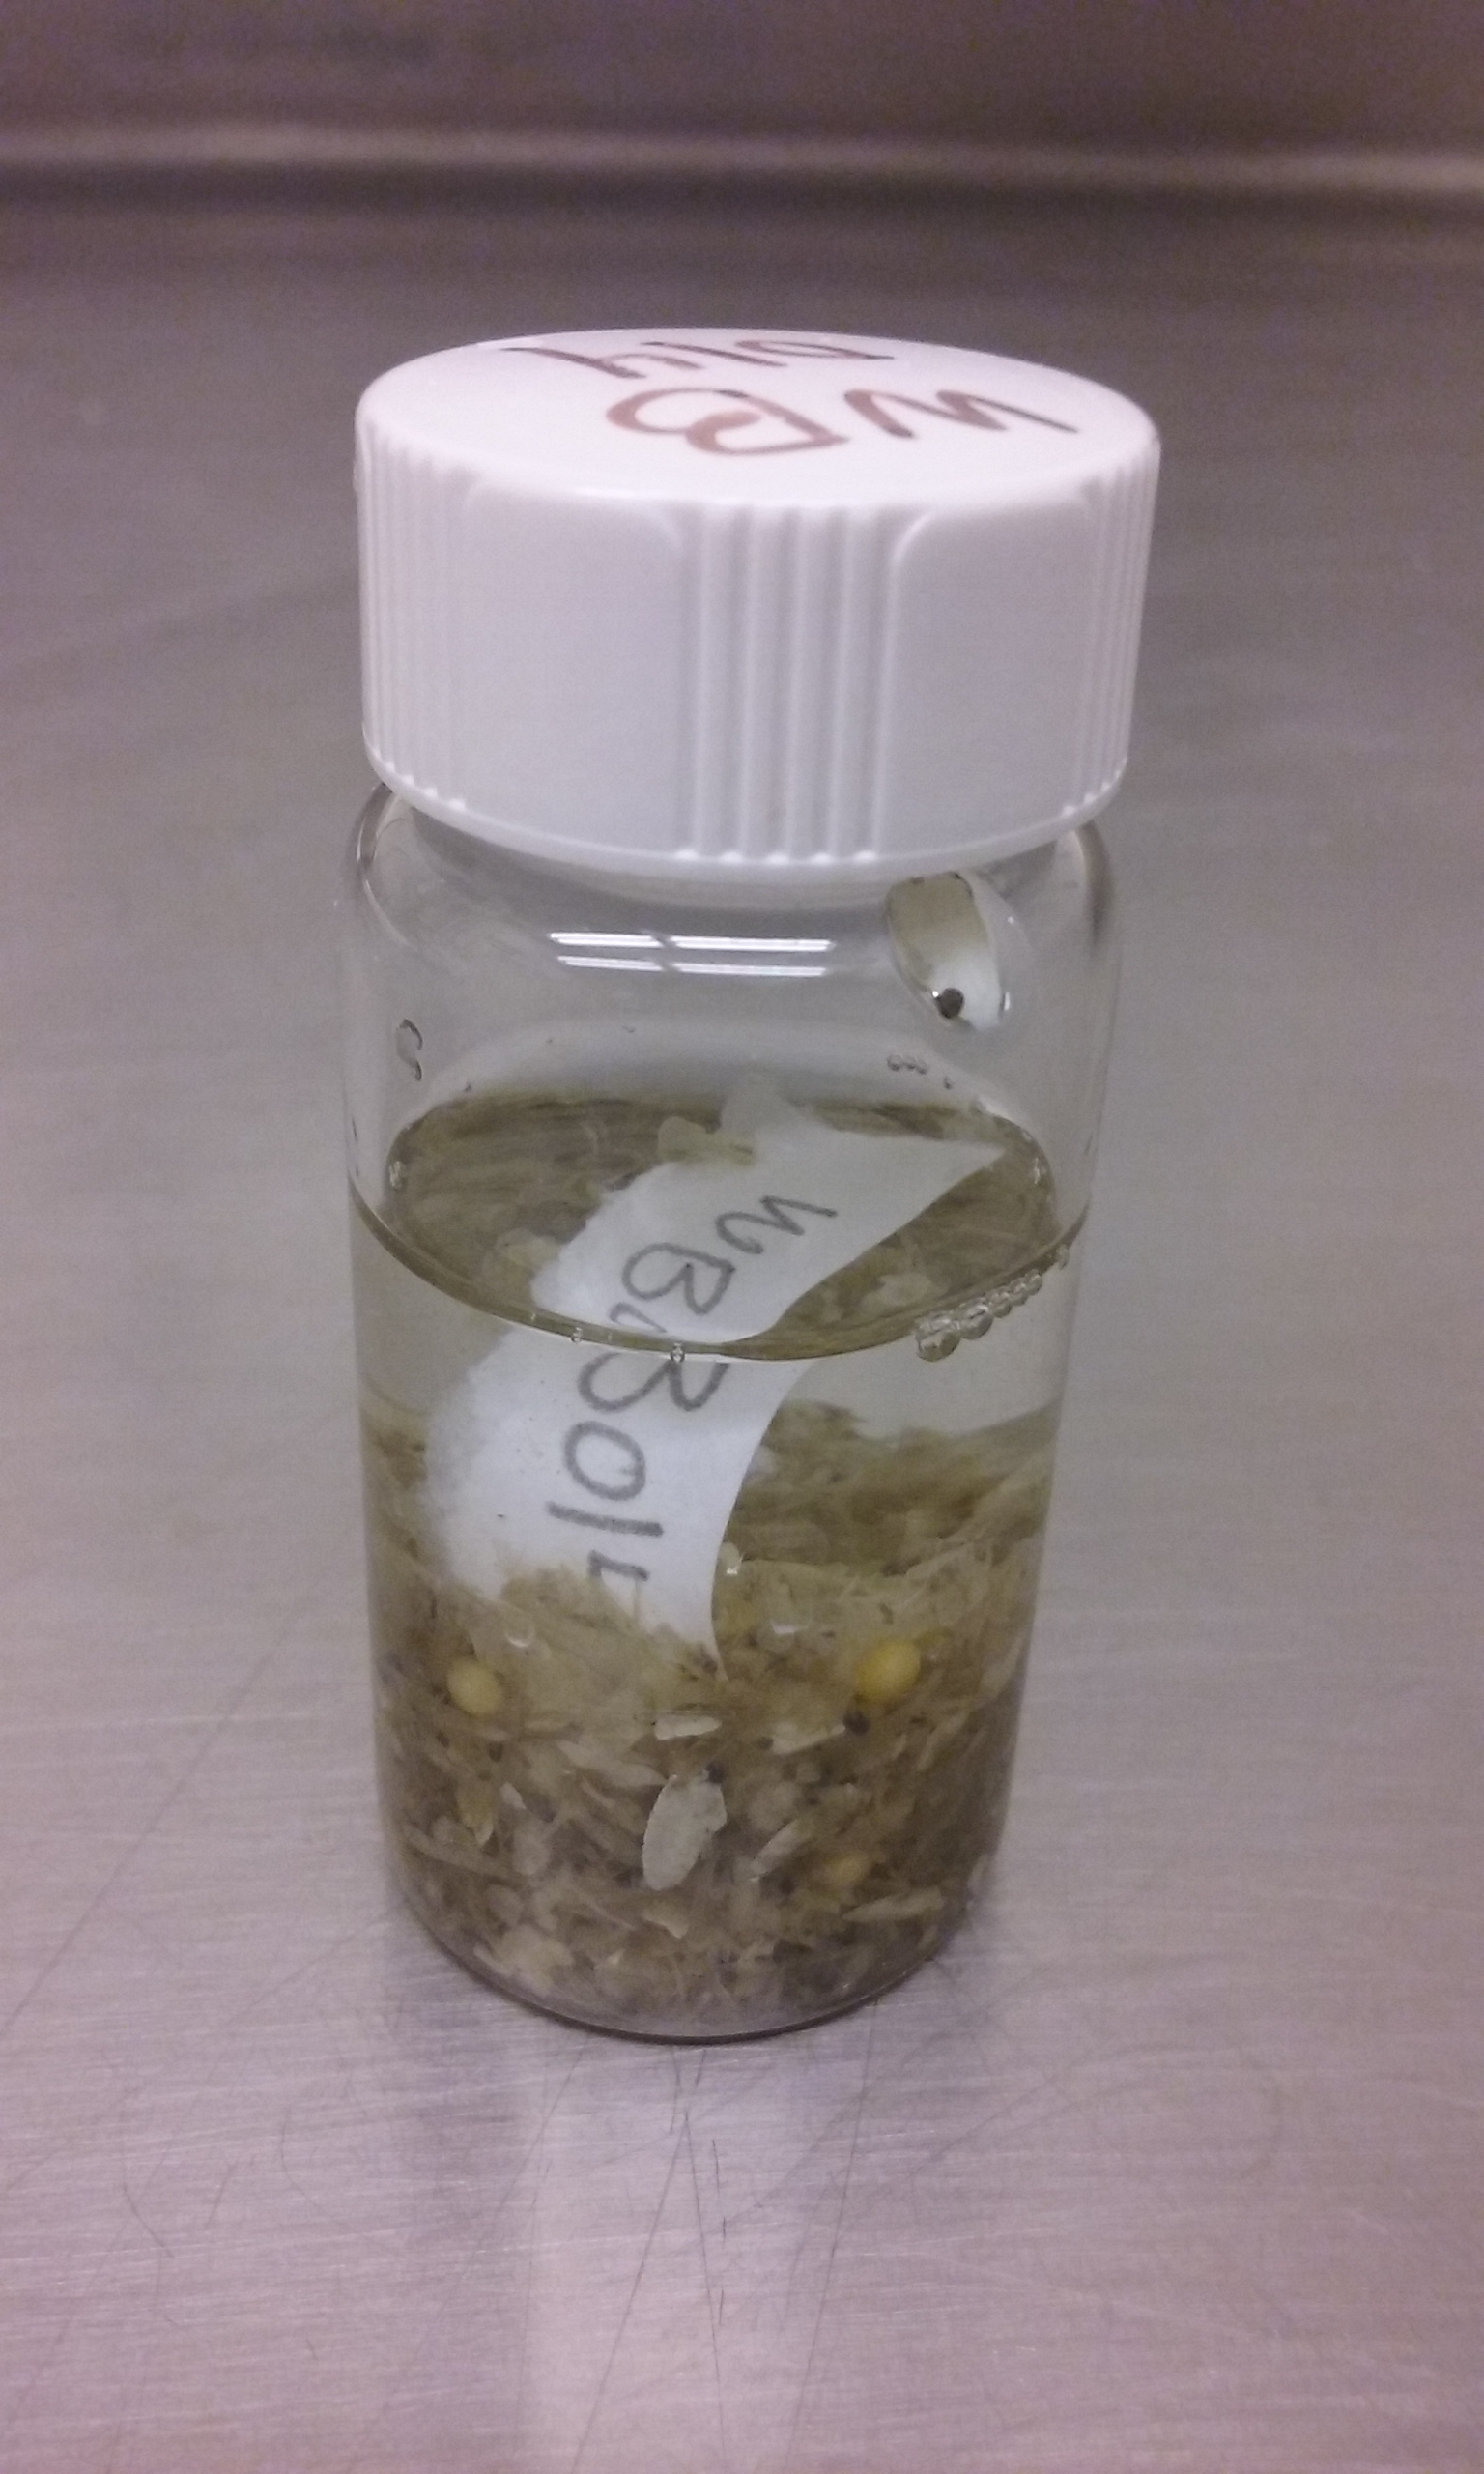
Photo by Madelyn Voelker
There are about 500 scat samples total. So far, about 50 have made it through the process described above. As usual when reporting on the progress of my thesis, there is still a way to go! After I finish sorting and storing hard parts, I will hand them off to William Walker, who has been contracted by Long Live the Kings to identify all hard parts to the lowest taxonomic level possible. The data collected from this effort will be used in conjunction with the molecular diet data to further understanding of harbor seal diet.