May 2018
Specialization correlations
Madelyn Voelker, graduate student
1 May 2018
One idea I am addressing with my thesis is the relationship between prey species and patterns in specialization. Essentially, we wanted to know if there were any prey species linked with high levels of specialization. To do this I compared the average specialization value for each scat to the proportion of each prey in that scat. This was done at both the order and species level.
This analysis yielded some very interesting patterns. One pattern that arose was that prey living low in the water column (e.g. close to the bottom) are more often correlated with a specialist diet (Table 1, Table 2). This was apparent at both the order and species level. For example, Clupeiformes, a largely pelagic (open water) order, correlated with a generalist diet (rho = .24, p < 0.001). Conversely, Pleuronectiformes, a demersal and benthic (close to the bottom) order, correlated with a specialist diet (rho = -0.38, p < 0.001). From a species lens: seventeen out of the eighteen species correlated with a specialized diet reside low in the water column (i.e. demersal, benthic, benthopelagic, bathypelagic, bathydemersal) (Table 2). Conversely, two out of the seven species correlated with a generalist diet reside low in the water column (Table 2). This pattern of a fish species’ ecology being linked with the level of specialization was even present within orders. The order Gadiformes includes Pacific herring Clupea pallasii, Pacific hake Merluccius productus, and walleye polluck Gadus chalcogrammus. The order did not show significant correlation with either specialist or generalist diets. However, when broken down into species, C. pallasii and M. productus, which are pelagic species, where correlated with generalist diet while G. chalcogrammus, a demersal species, was correlated with a specialist diet.
Table 1. Correlations of prey proportions (by order) to Spi values of Salish Sea harbor seals. Only correlations with p > 0.05 are shown. A negative rho value indicates a positive correlation with specialization. Analysis represents 1,083 samples from groups with > five samples.
Order |
rho |
p |
Number of occurrences |
Chimaeriformes |
-0.62 |
< 0.001 |
28 |
Rajiformes |
-0.52 |
0.002 |
32 |
Scorpaeniformes |
-0.50 |
< 0.001 |
132 |
Perciformes |
-0.48 |
< 0.001 |
194 |
Batrachoidiformes |
-0.40 |
< 0.001 |
82 |
Pleuronectiformes |
-0.38 |
< 0.001 |
154 |
Adult Salmoniformes |
0.27 |
< 0.001 |
595 |
Clupeiformes |
0.24 |
< 0.001 |
538 |
Cephalopoda |
0.39 |
< 0.001 |
163 |
Table 2. Correlations of prey proportions (by species) to Spi values of Salish Sea harbor seals. Only correlations with p > 0.05 are shown. A negative rho value indicates a positive correlation with specialization. Analysis represents 1,083 samples from groups with >5 samples. Prey species with < three occurrences total were discarded before analysis.
Species |
Habitat |
rho |
p |
Number of occurrences |
Prickly Sculpin |
Demersal |
-0.81 |
0.022 |
7 |
Wolf Eel |
Demersal |
-0.73 |
0.015 |
10 |
Snake Prickleback |
Benthopelagic |
-0.72 |
< 0.001 |
24 |
Dover Sole |
Demersal |
-0.69 |
0.016 |
11 |
Pacific Sand Lance |
Benthopelagic |
-0.66 |
0.004 |
17 |
Spotted Ratfish |
Demersal |
-0.62 |
< 0.001 |
28 |
Longfin Smelt |
Benthopelagic |
-0.62 |
0.008 |
17 |
English Sole |
Demersal |
-0.53 |
< 0.001 |
39 |
Pacific Staghorn Sculpin |
Demersal |
-0.48 |
< 0.001 |
76 |
Starry Flounder |
Demersal |
-0.47 |
0.002 |
38 |
Northern Anchovy |
Pelagic-neritic |
-0.45 |
0.006 |
35 |
Lingcod |
Demersal |
-0.45 |
0.030 |
23 |
Shiner Surfperch |
Demersal |
-0.45 |
< 0.001 |
112 |
Surf Smelt |
Benthopelagic |
-0.44 |
0.025 |
25 |
Big Skate |
Demersal |
-0.41 |
0.030 |
27 |
Plainfin Midshipman |
Demersal |
-0.40 |
< 0.001 |
82 |
Northern Smoothtongue |
Bathypelagic |
-0.40 |
0.042 |
25 |
Walleye Pollock |
Benthopelagic |
-0.26 |
< 0.001 |
228 |
Pacific Hake |
Pelagic-neritic |
0.12 |
0.048 |
280 |
Juvenile sockeye salmon |
Pelagic-oceanic |
0.22 |
< 0.001 |
170 |
Pacific Herring |
Pelagic-neritic |
0.29 |
< 0.001 |
498 |
Speckled Sanddab |
Demersal |
0.34 |
0.02 |
48 |
Adult sockeye salmon |
Pelagic-oceanic |
0.36 |
< 0.001 |
179 |
Adult pink salmon |
Demersal |
0.38 |
< 0.001 |
218 |
Pacific Red Octopus |
Pelagic-oceanic |
0.53 |
< 0.001 |
128 |
Eulachon |
Pelagic-neritic |
0.61 |
< 0.001 |
23 |
As often happens in science, these results are very interesting, but raise more questions than they answer. We now know that there are patterns in prey consumption and specialization, likely connected to the ecology of the prey species. Now the paramount question is, at it’s most basic level, “What is causing this pattern we observed?”. One hypothesis we have for the cause is limits on harbor seal search images and foraging strategies. If seals are limited in the number of search images and foraging strategies (which has been observed in other species), then the number of different prey species they consume is dictated by the number of species that fit their search image/foraging strategy. Further, if pelagic species are more morphologically similar to each other than benthic species, then a seal that is practiced in open water hunting will likely be able to consume a larger range of species.
This hypothesis will not be tested in my thesis, but it will be discussed! So, if you are interested in hearing more, you can read my thesis - which should be hitting the shelfs in just a couple months. And hopefully, this hypothesis will be a starting point for another future study!
Science is tough
MacKenna Nemmarch, undergraduate student
1 May 2018
This morning I woke up and knew it was going to be a challenging day. I immediately listed off all the things I had to complete before my day was over: take my developmental biology midterm, interview four new applicants to the project, read 50 pages of my algae textbook for my quiz tomorrow, and spend some quality time organizing the data to present a beautiful blog post. I had to immediately pull back the reins on the panicked feeling that began to swallow up my sense of productivity and decided to take things step by step.
By 5pm, I sat down in the lab, pulled up the data, and prepared myself to finish tying surfacing events to individuals within three hours. I put some on some Debussy and didn’t look at the clock until it was suddenly 9pm. I had finished a fifth of the work I had intended to do. The perfectionist in me immediately began to type out an email to email Alejandro, plead for an extension on the blog, and continue organizing the data until I could no longer keep my eyes open. Before I hit send, I pondered - who was I trying to please? Why was it that I felt the need to punish myself to complete a goal that only I had set? I could feel a weight lift off my shoulders as I chose to simply be content with where I was at, present what I had, and be okay with it. And so, without further adieu, I present to you, 40 hours of sweat, tears, and coffee:
Date |
Time |
ID |
Success |
11/28/2011 |
7:30 |
NA |
No |
11/10/2012 |
14:33 |
NA |
No |
11/22/2014 |
16:35 |
37 |
Yes |
11/8/2015 |
15:25 |
5 |
Yes |
11/21/2015 |
12:04 |
100 |
No |
11/21/2015 |
12:13 |
100 |
No |
11/21/2015 |
12:35 |
100 |
No |
11/21/2015 |
13:34 |
85 |
No |
11/21/2015 |
13:44 |
39 |
Yes |
11/22/2015 |
12:39 |
98 |
No |
11/22/2015 |
12:50 |
62 |
Yes |
11/25/2015 |
16:09 |
6 |
Yes |
12/4/2015 |
11:04 |
137 |
No |
12/4/2015 |
11:30 |
6 |
No |
12/4/2015 |
12:09 |
104 |
No |
12/4/2015 |
12:20 |
137 |
No |
12/4/2015 |
12:22 |
137 |
No |
12/4/2015 |
12:25 |
104 |
No |
12/4/2015 |
12:27 |
147 |
No |
12/5/2015 |
12:52 |
14 |
Yes |
12/5/2015 |
12:59 |
4 |
No |
12/5/2015 |
13:02 |
4 |
No |
12/5/2015 |
13:04 |
14 |
No |
12/5/2015 |
13:05 |
14 |
No |
12/5/2015 |
13:09 |
14 |
No |
12/5/2015 |
13:10 |
NA |
No |
12/5/2015 |
13:17 |
39 |
No |
12/6/2015 |
12:43 |
4 |
No |
12/6/2015 |
12:50 |
6 |
No |
12/6/2015 |
12:54 |
6 |
No |
12/6/2015 |
12:58 |
4 |
No |
12/6/2015 |
13:20 |
6 |
No |
12/6/2015 |
13:23 |
6 |
No |
12/6/2015 |
13:28 |
6 |
No |
12/8/2015 |
14:42 |
3 |
No |
12/12/2015 |
11:23 |
6 |
No |
12/15/2015 |
13:24 |
147 |
No |
12/15/2015 |
13:31 |
147 |
No |
12/15/2015 |
13:44 |
147 |
No |
12/15/2015 |
13:52 |
147 |
No |
12/15/2015 |
14:00 |
147 |
No |
That is it. It does not look like much, but this is every logged event where a seal was turned upside down that I manually sorted out of 8500 data points. I sifted through tens of thousands of photos to tie each one of these events to an individual (which is far from easy when the seal is upside down) and figure out if this event lead them to catch a fish successfully. I repeat, and emphasize, that is it!
To say I have a found a new level of respect for science through this study is a gross understatement. Naive, unseasoned freshman-in-college MacKenna thought being a scientist was a job of riveting field work with the wind blowing through your hair and something exciting to write home about every day. The reality is that science can be challenging and downright discouraging most of the time. While there are many important qualities required to be successful in this field, it would seem the most important are being patient and persistent in accomplishing your goals, overcoming hurdles that you will inevitably face, and adapting your work ethic to make this process more efficient. Yet, somehow, the struggle of it all only becomes a more appealing way to spend the next several years of my life.
Stay tuned for a lot more data and hopefully less whining!
Where to start when analyzing interviewing results
Alisa Aist, undergraduate student
1 May 2018
As the IRB paperwork goes through I am starting to figure out how to analyze the data that I will receive from my interviews. There are many programs, but finding the right one is based on your abilities and your questions. So the first thing to do is create a table with information about your questions, like this one from Avila-Foucat et al. (2017 ).
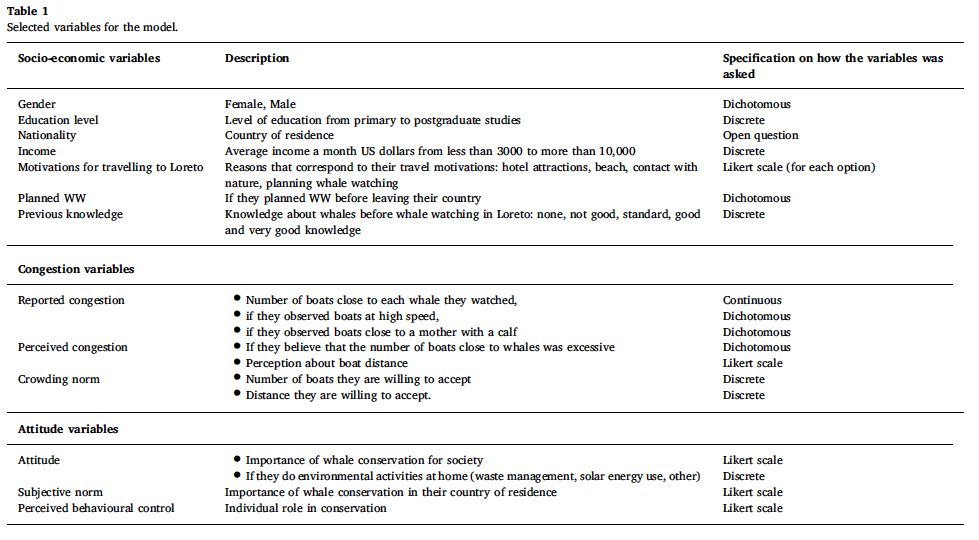
The part of your overall inquiry is the first thing for each question, then a description of the question and last the type of answer given. Elsewhere in the methods sections a further explanation for the purpose behind each question should be explored. This helps to explain why a questions was asked and what a subject’s answer means for the study.
There are also the models that include the results form the questions. The researcher must test for correlations to determine which questions help to answer the inquiry. Those questions which are correlated can be used to generalize for the rest of the population being studied. For example I am going to interview some people in Bellingham, but not everyone. So I can ask my questions and see which answers correlate to each other and the demographics gathered to get a sense of what people in Bellingham think. To create these models there are different modeling software. For answers that can be easily changed into number values mathematical software such as R can compare answers. However, open ended questions make it difficult assign values and other software like IBM’s SPSS Text Analytics for Surveys can do much for the work for you. My interview survey is a mix of a simple questionnaire which can be analyzed quantitatively and a true interview with no defined answers to an open ended question.
There are many approaches to organizing the questions. The thematic content analysis is an interesting one as seemed to be used by Avila-Foucat et. al. (2017). The organization of the questions is shows themes of socio-economics, congestion and attitude, each theme diving into a different part of the overall question. This is a particularly descriptive method for displaying and analyzing the data (Anderson, 2007). Atkinson et al. (2008) agreed stating that this method was more suggestive than analysis.
As I continue working towards my own analysis I am looking forward to learning more about the variety of methods and software used to analyze surveys.
References
- Anderson, R. (2007) Thematic Content Analysis (TCA): Descriptive presentation of qualitative data. (unpublished manuscript). Available online [Accessed may 1, 2018].
- Atkinson, J. W., McClelland, D. C., & Veroff, J. (2008). Motivation and Personality Handbook of Thematic Content Analysis. Eidted by Smith,C. P. Cambridge University Press.
- Avila-Foucat, V. S., Gendron, D., Revollo-Fernandez, D., Popoca, E. I., & Ramírez, A. (2017). Determinants of the potential demand for whale watching in Loreto Bay National Park. Marine Policy, 81, 37-44.